
In Q2, the Curve index shot upwards, driving higher into year-over-year truckload rate inflation — that trend has not only continued, but accelerated, the third quarter.
Though the overall demand picture remains muted in an uncertain economic backdrop, sustained pressure on the supply side of the market (carriers) has created a tight environment for shippers.
As we approach peak season shipping, will we continue to see an even higher shift upwards in truckload market rates?
Should companies be dusting off their “Shipper of Choice” playbooks for the end of 2026?
Q3 Truckload Market:
The Complete Guide for Logistics Pros
What you’ll learn in this comprehensive update:
- Q2 2026 truckload market recap
- Macroeconomic outlook
- 7 trucking trends to watch right now
- Q3 2026 truckload market forecast
- Curve infographic
New to the Curve?
These essential truckload market resources will give you foundational industry knowledge and teach you how how we build our proprietary spot rate index.
Want slides for your next presentation?
Download all the Curve charts and graphs, formatted for slides.
Spot & Contract Trucking Rate Recap: Q2 2026
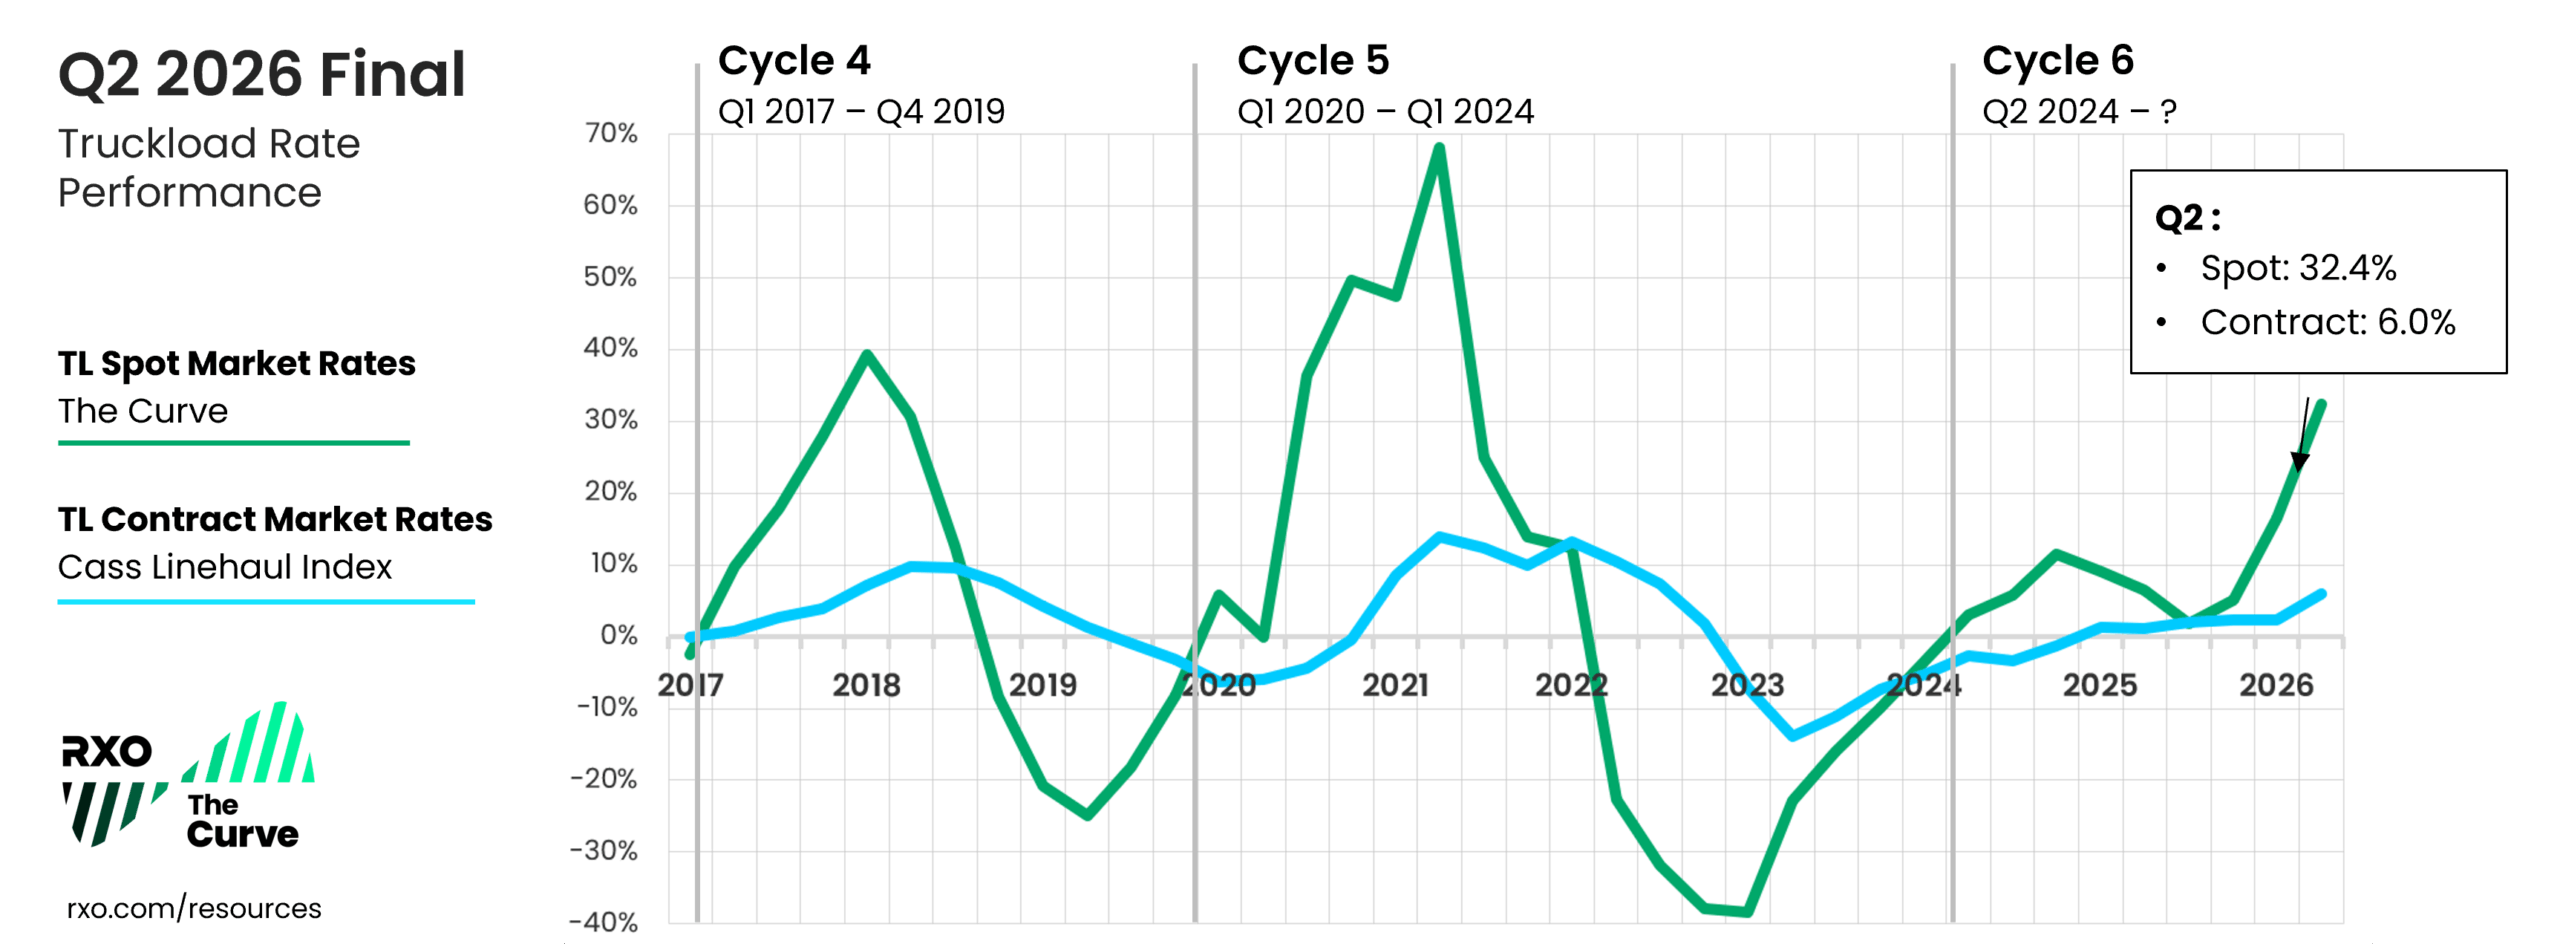
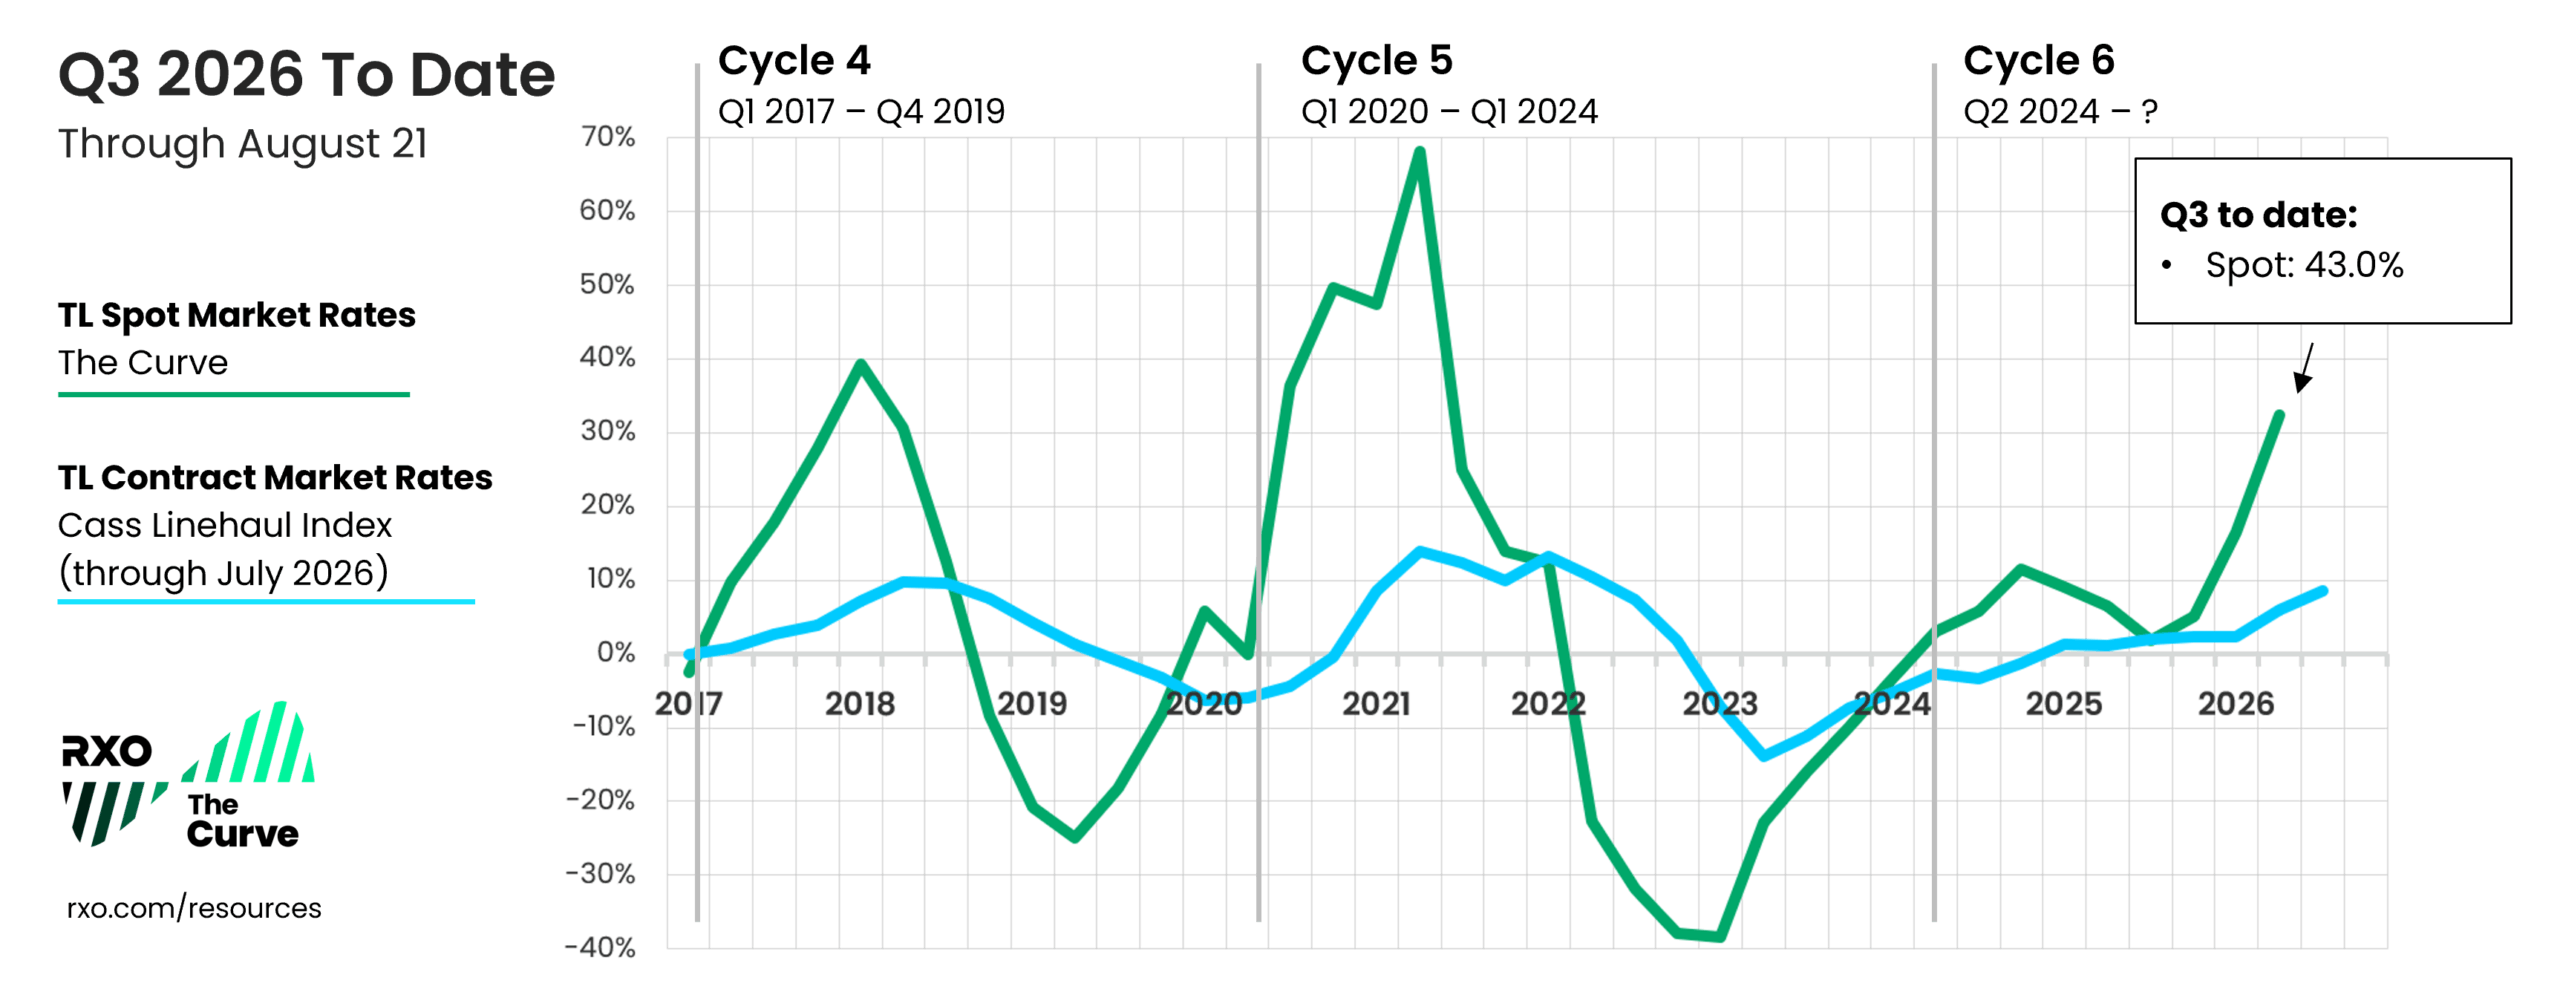
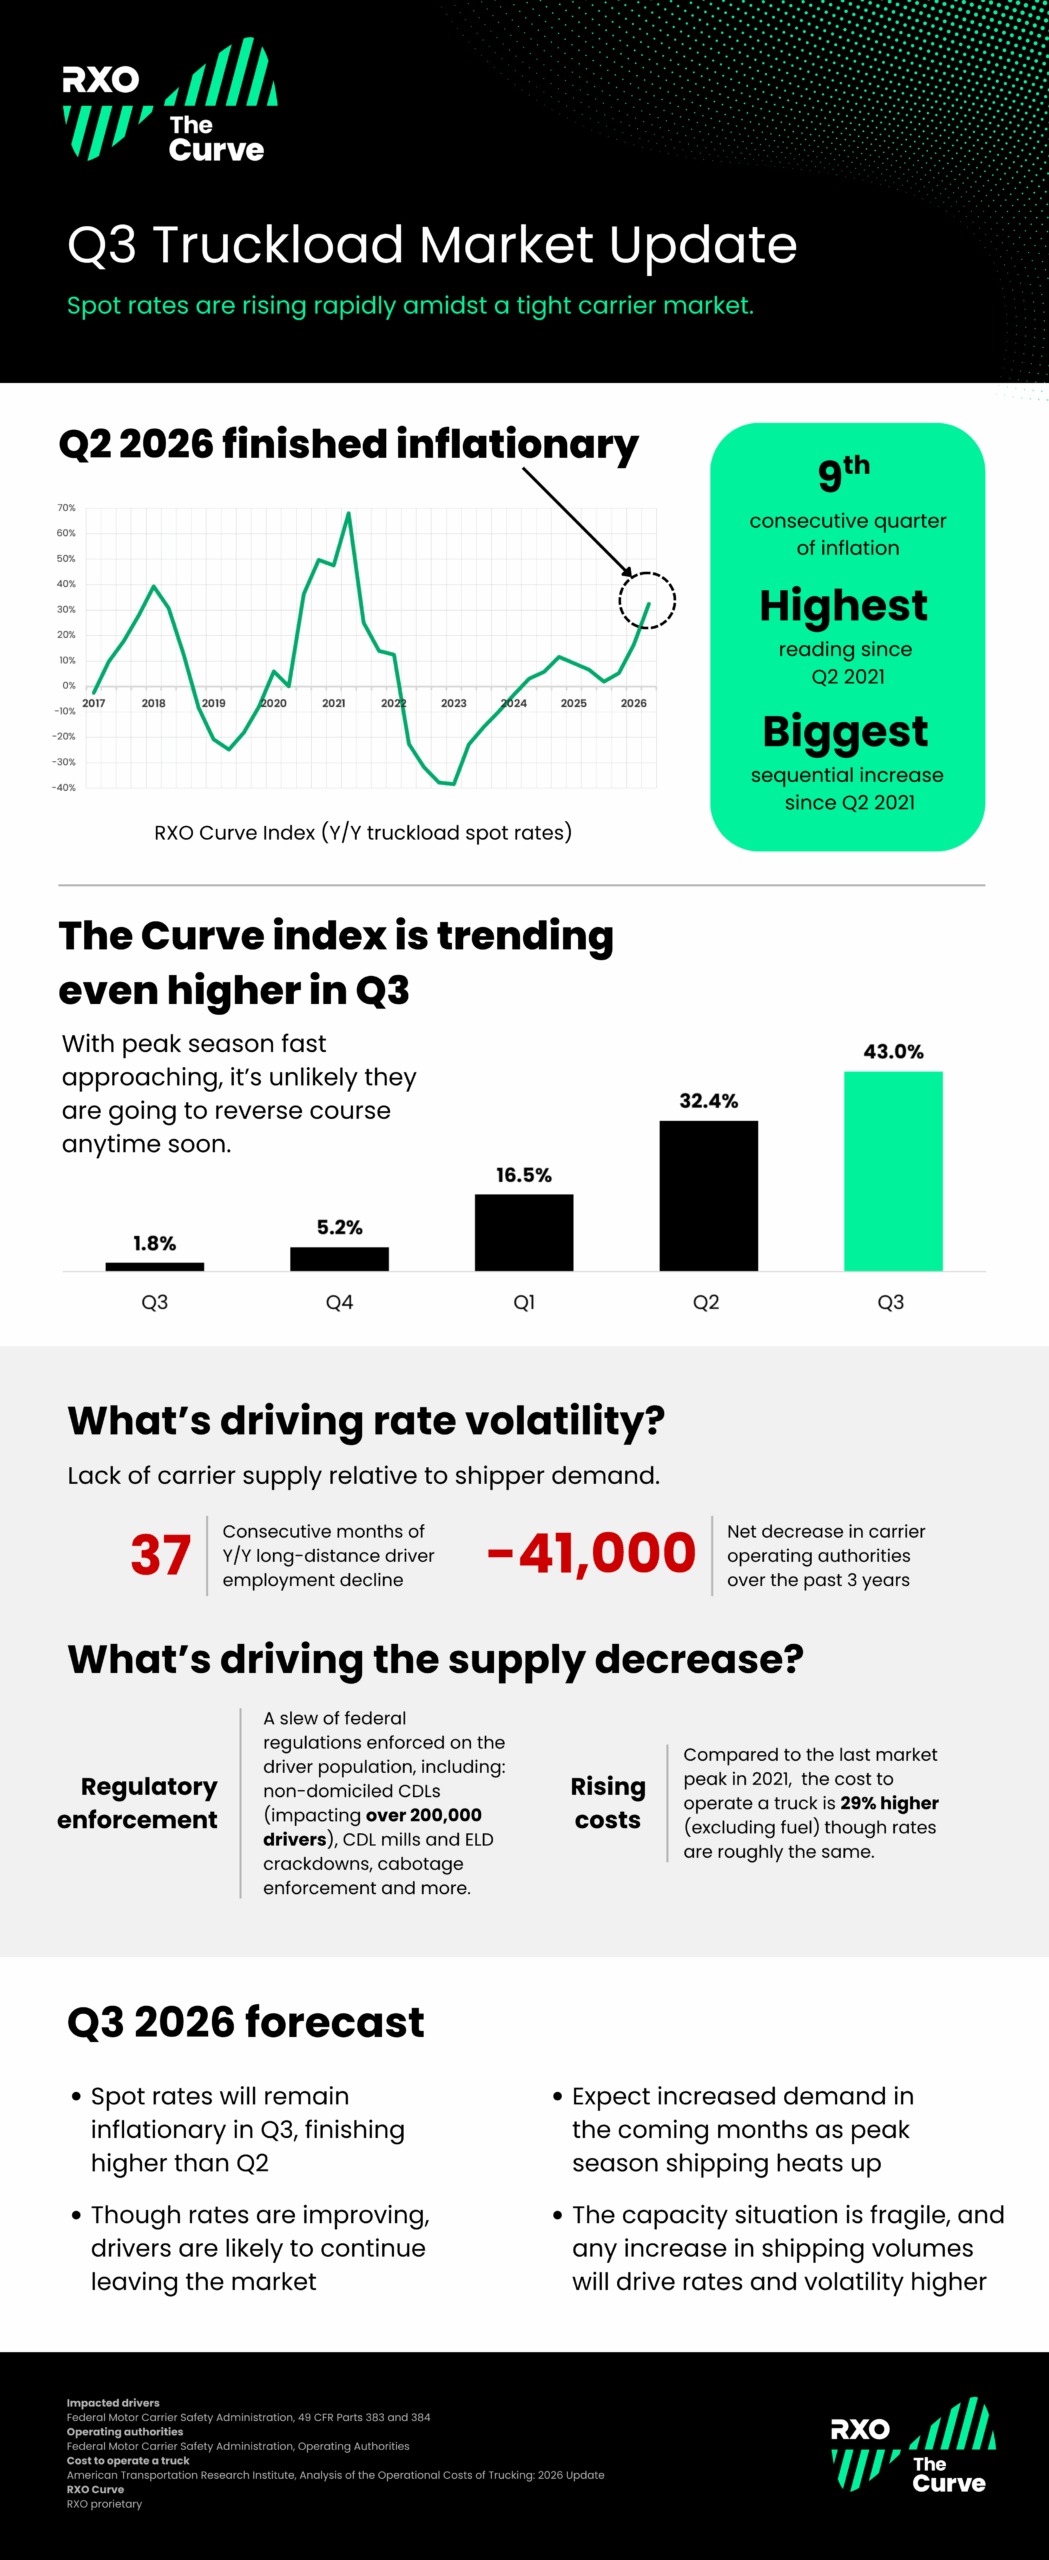
The RXO Curve index continued to move higher into year-over-year inflationary territory, notching its ninth consecutive inflationary reading, the highest reading since Q2 2021 as well as the biggest sequential increase since Q2 2021.
- Q2 truckload spot rates remained inflationary, up from Q1
Truckload spot rates, (linehaul only, excluding fuel), increased 32.4% year-over-year in Q2, up from 16.5% in Q1. - Q2 truckload contract rates remained inflationary, up from Q1
Truckload contract rates* increased to 6.0% year-over-year, up from 2.4% in Q1.
Download all the Curve charts for your next presentation.
Actual Spot Truckload Rates vs. Year-Over-Year
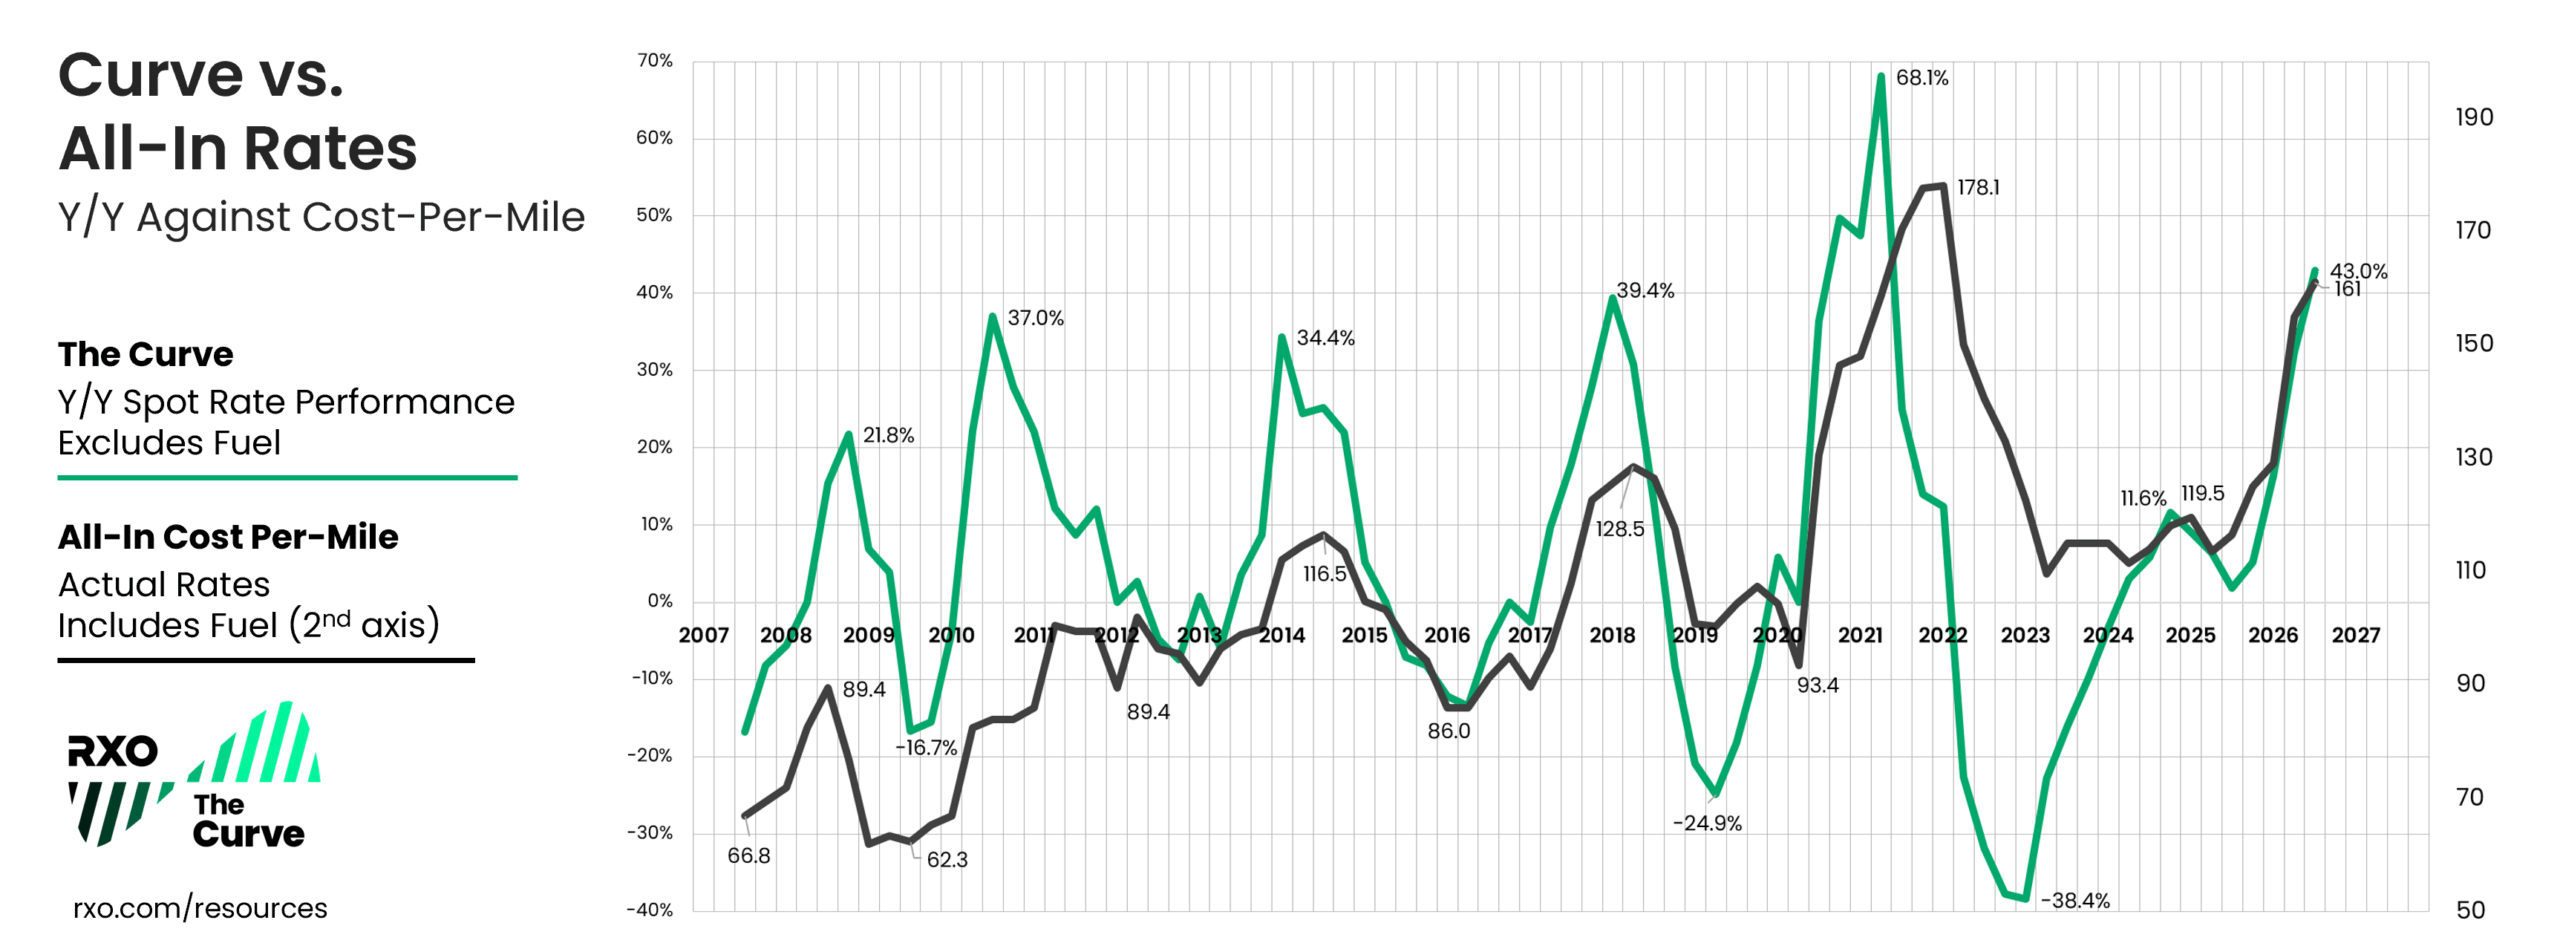
To build further confidence in the Curve (a year-over-year spot rate index), let’s see it up against our proprietary all-in cost-per-mile index — this is comparing annual change (without fuel) versus the actual rate (all-in cost, with fuel included).
As a reminder, these numbers are informed by real transactional data from thousands of daily shipments over the last 18 years.
For the better part of two years (Q3 2023 to Q3 2025), this index was essentially flat, hovering around 115 (for comparison, during COVID-era shipping in the early parts of the previous truckload market cycle, the index rose to a peak of 178.1).
In Q4 2025, the all-in index finally gained some momentum, ticking up to 125, and in Q1 2026, it went even higher to 129.
In Q2 2026, the index shot up to 154.9 — the highest reading since Q1 2022.
While some of this was driven by dramatically increasing fuel costs (see trucking trends section), diesel doesn’t account for all of the surge.
Download all the Curve charts for your next presentation.
Q2 2026 Truckload Market: Key Takeaways
- The Curve (measuring year-over-year change in linehaul spot rates, excluding fuel) remained in inflationary territory and increased sequentially in Q2.
- All-in rates (actual amount paid to carriers) increased to their highest level in four years.
- Despite improving spot rates, carriers remained under significant cost pressure, exacerbated by higher fuel prices.
State of the Industry: Macroeconomic Overview
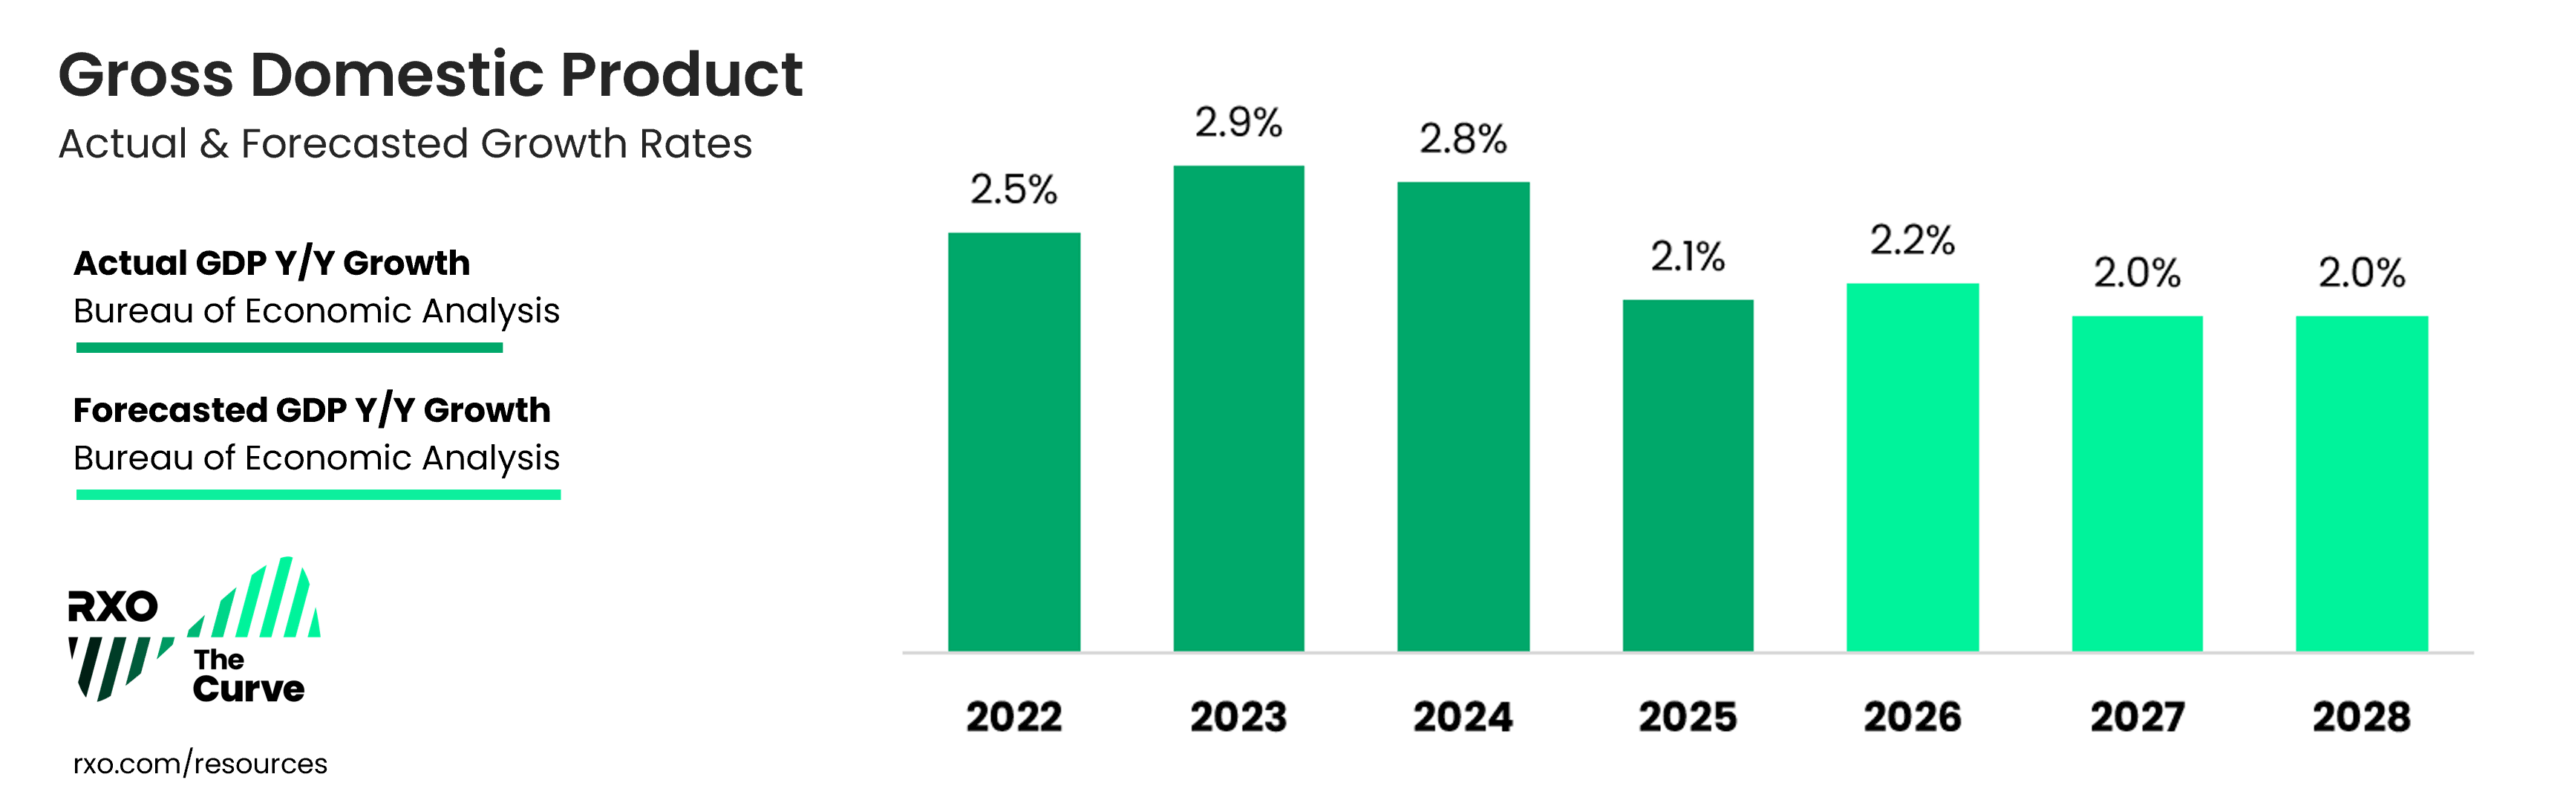
Through the first half of 2026, U.S. real gross domestic product (GDP) has remained stable, at 2.4% growth year-over-year (though it dipped from 2.7% in Q1 to 2.1% in Q2, and the full year forecast is 2.2%).
However, stubborn inflation (exacerbated by fuel prices), elevated interest rates and ongoing geopolitical tension are producing a looming overhang of uncertainty and consumer anxiety.
Inflation & Interest Rates
Overall inflation across the U.S. economy remains persistently higher than the Federal Reserve’s target rate of 2%.
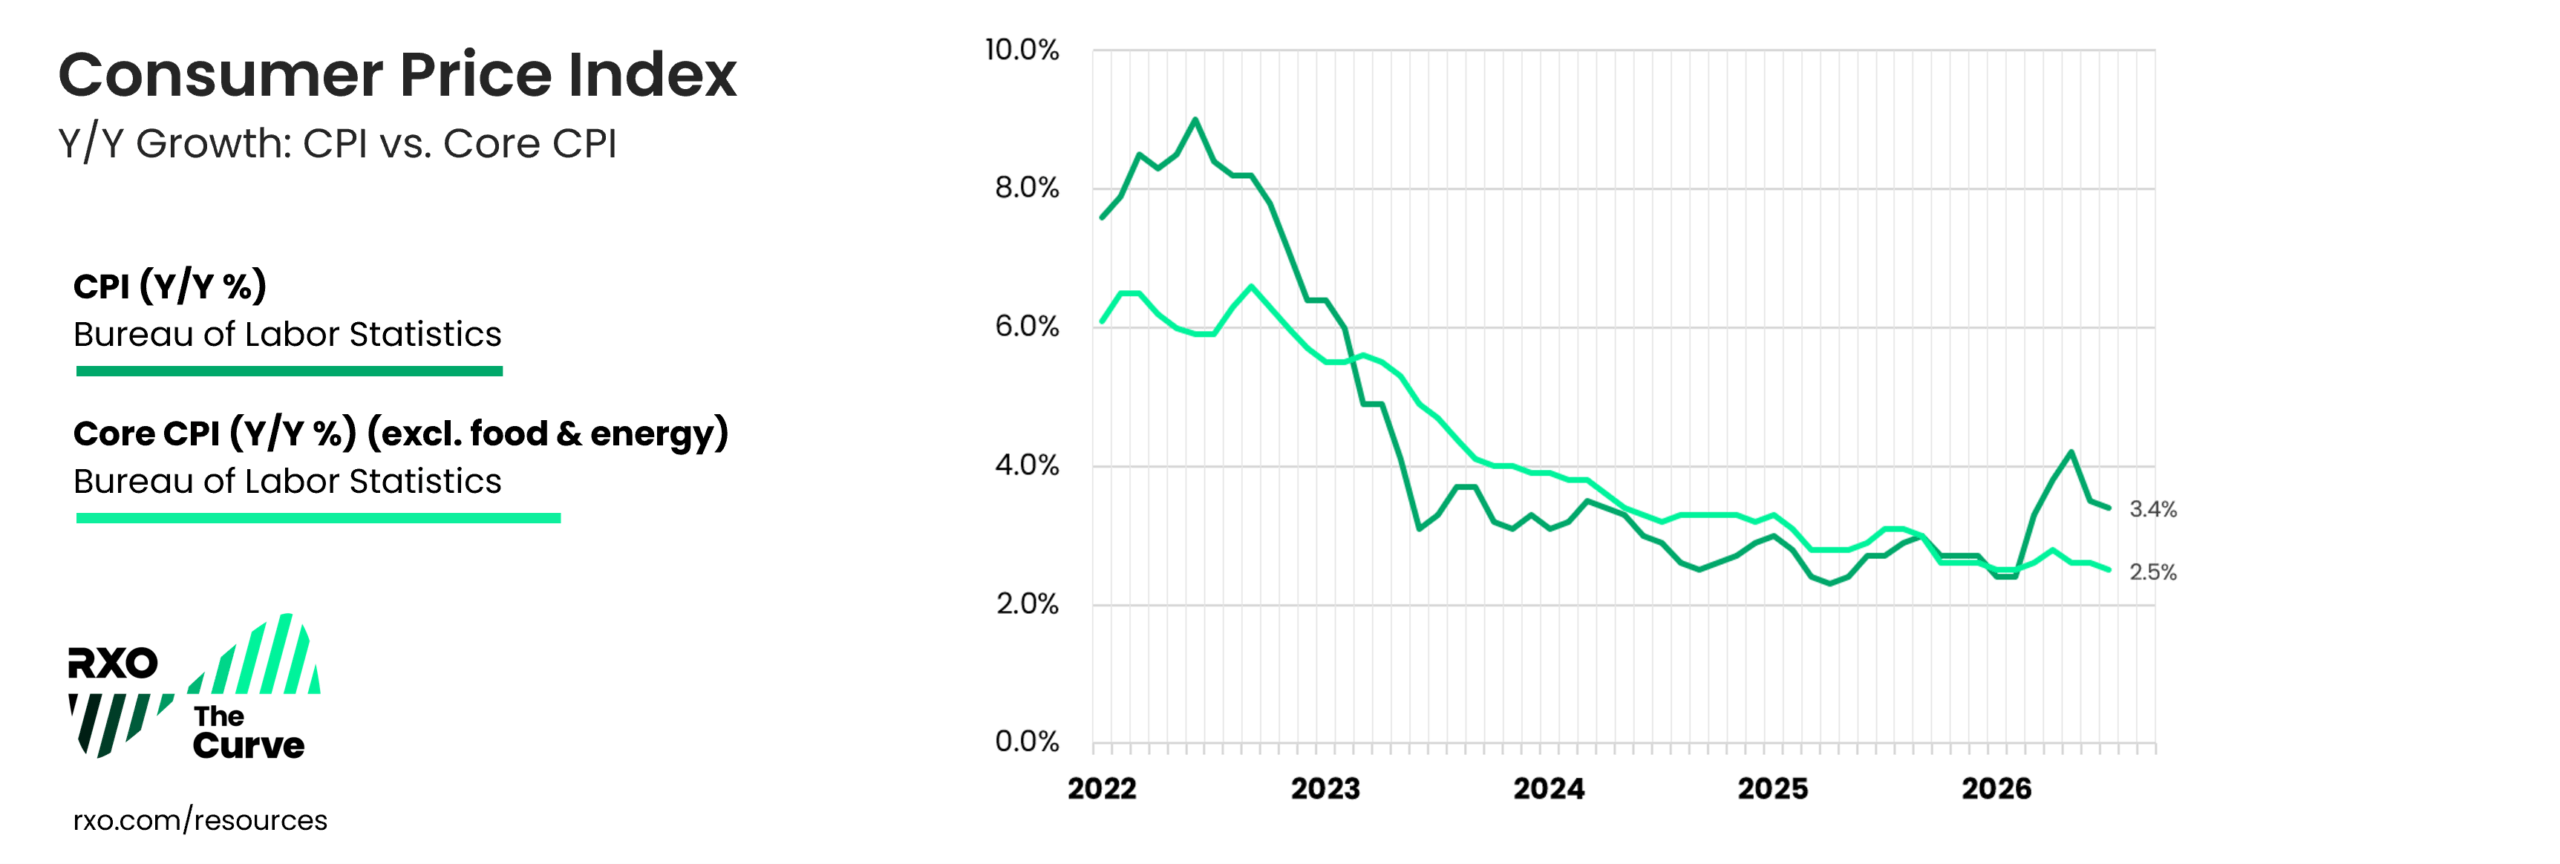
After rising to 3.0% year-over-year in September 2025, the Consumer Price Index (CPI) eased downwards for several months, getting as low as 2.4% in February this year.
However, inflation reversed course with the start of hostilities between the U.S. and Iran and the subsequent disruption of global oil trade.
The CPI rose to 3.3% in March, 3.8% in April, and 4.2% in May (a three-year high), with most of those increases driven by a sharp spike in fuel prices.
In June, the index, though still elevated, moderated down to 3.5%. Encouragingly, core inflation, which excludes volatile food and energy prices, remained flat from May at 2.6% (although this is still higher than the Fed’s 2% target rate).
The Federal Reserve and Rate Cuts
After multiple rate cuts in 2024, the Fed sat tight until their September 2025 meeting, where they cut interest rates by 25 basis points (bps). The Fed cut rates by an additional 25 bps in October, and another 25 bps in December.
These cuts brought rates down to their lowest level since 2022.
Since then, the Fed has kept rates steady for five consecutive meetings, including under the leadership of the new Chair of the Federal Reserve, Kevin Warsh, who began his term in May.
Currently, markets are pricing in one additional hike by the end of the year, though the situation is fluid and is closely linked to global energy prices.
Through mid-August, thirty-year U.S. Treasury bond yields have continued to move upwards, reaching their highest level since 2007. The market is concerned that in order to keep inflation in check, the Fed will need to keep interest rates higher for longer — this is compounded by continued increases in the Federal debt.
Notably, the U.S. Treasury recently took action to provide relief, announcing it would double its buyback operations. This supports liquidity and could put additional downward pressure on bond yields, which would provide a near-term boost to the economy.
Tariff and Trade Policy Impact
Throughout 2025, the U.S. government struck several important deals with major trading partners, and the average effective tariff rate for the U.S. has remained effectively flat since May last year.
At this point, most non-tariffed goods (purchased in a flurry of imports early last year) have already worked their way through domestic supply chains.
With shippers now buying imports at higher rates, they must choose between shrinking profitability or passing through increased costs to consumers.
Tariff Timeline: Trade Policy Highlights
- February 2025: Implementation
Initial tariffs on China, Canada and Mexico are announced. - April 2025: “Liberation Day”
Reciprocal tariffs applied broadly to most countries. - February 2026: IEEPA ruled unlawful
The legal basis for much of the Administration’s trade policy hinged on the ability to use broad emergency powers to implement tariffs (specifically, the International Emergency Economic Powers Act or IEEPA). In the past, tariffs were generally under the purview of Congress.Several small businesses and a group of states challenged the legality of these tariffs, which they contended were an overreach of executive branch authority. The case made its way through the lower courts, and reached the U.S. Supreme Court, which had an initial hearing on November 5th.On February 20th, the Supreme Court ruled that the tariffs exceed the powers given to the presidentunder IEEPA.Starting in April, the U.S. Customs and Border Protection (CBP) is rolling out a refund process in a phased approach. To claim refunds, importers must file through a newly implemented system. The CPB estimates they will process refunds within 60 to 90 days of filing.
- February 2026: Section 122 tariffs invoked
After the Supreme Court struck down the IEEPA tariffs in February, the administration immediately invoked Section 122 of the Trade Act of 1974 (for unfair trade practices), imposing a 10% surcharge. - May 2026: Section 122 tariffs challenged
On May 7th , 2026, the Court of International Trade (CIT) ruled that these new tariffs were unlawful.On May 8th , 2026, the Department of Justice appealed this decision to the U.S. Court of Appeals for the Federal Circuit, and on May 12th, the government was granted a temporary stay of the CIT’s injunction. Most importantly, on June 11, the court granted a fuller stay pending appeal, meaning the government continued to collect Section 122 tariffs through the remainder of the tariff’s term. - July 2026: Section 122 tariffs expire
Section 122 Tariffs are temporary by design and can only remain in effect for 150 days (unless Congress passes a specific law to extend them).On July 24th, the Section 122 tariffs expired. - July 2026: Section 301 tariffs implemented
Section 301 of the Trade Act of 1974 allows the president to impose tariffs on countries that engage in unfair trade practices.They are more complex to implement (compared to Section 122), requiring investigations by the Office of the United States Trade Representative (USTR). On June 2nd, the USTR determined that, “The acts, policies, and practices of each of these economies are unreasonable and burden or restrict U.S. commerce and thus are actionable under section 301.”As soon as the Section 122 tariffs expired, the Trump administration implemented Section 301 tariffs. - August: Section 301 tariffs challenged
On August 3rd, 25 states sued the Trump administration in the U.S. Court of International Trade over the new tariffs, stating that the administration had once again exceeded its authority and was trying to circumvent the decision from the Supreme Court. - August: Breakdown with Canada
Talks collapsed on August 21st over U.S. demands to limit Canada’s other trade deals and disagreement on auto tariff scope (cars only, not trucks). Tariffs of 50% are now in effect, with Canadian retaliation set for Sept. 8. Carney’s language on diversifying trade partnerships and building “strength at home” suggests Canada is positioning for a prolonged standoff rather than a quick return to the table.
However this shakes out, this could lead to more volatile trade policy and have a significant impact on the economy.
Consumer Confidence
Though the inflationary impact of tariff implementation has been less than originally feared (at least, so far), the U.S. consumer has been leery of how tariffs will impact the economy.
Consumer sentiment (according to the University of Michigan Consumer Sentiment Index) hovered around its lowest ever readings for most of 2025 and recorded its second-lowest reading on record in November.
With the onset of the war with Iran, the index dropped again, hitting yet another all-time low in May 2026.
Though it has risen slightly in both June and July, it again moved lower in August and is still tracking significantly below its long-term average.
Ultimately, inflation and the potential for future interest rate cuts are inextricably linked to changes in both trade policy and geopolitical conflicts, both of which have been highly fluid.
Industrial Demand
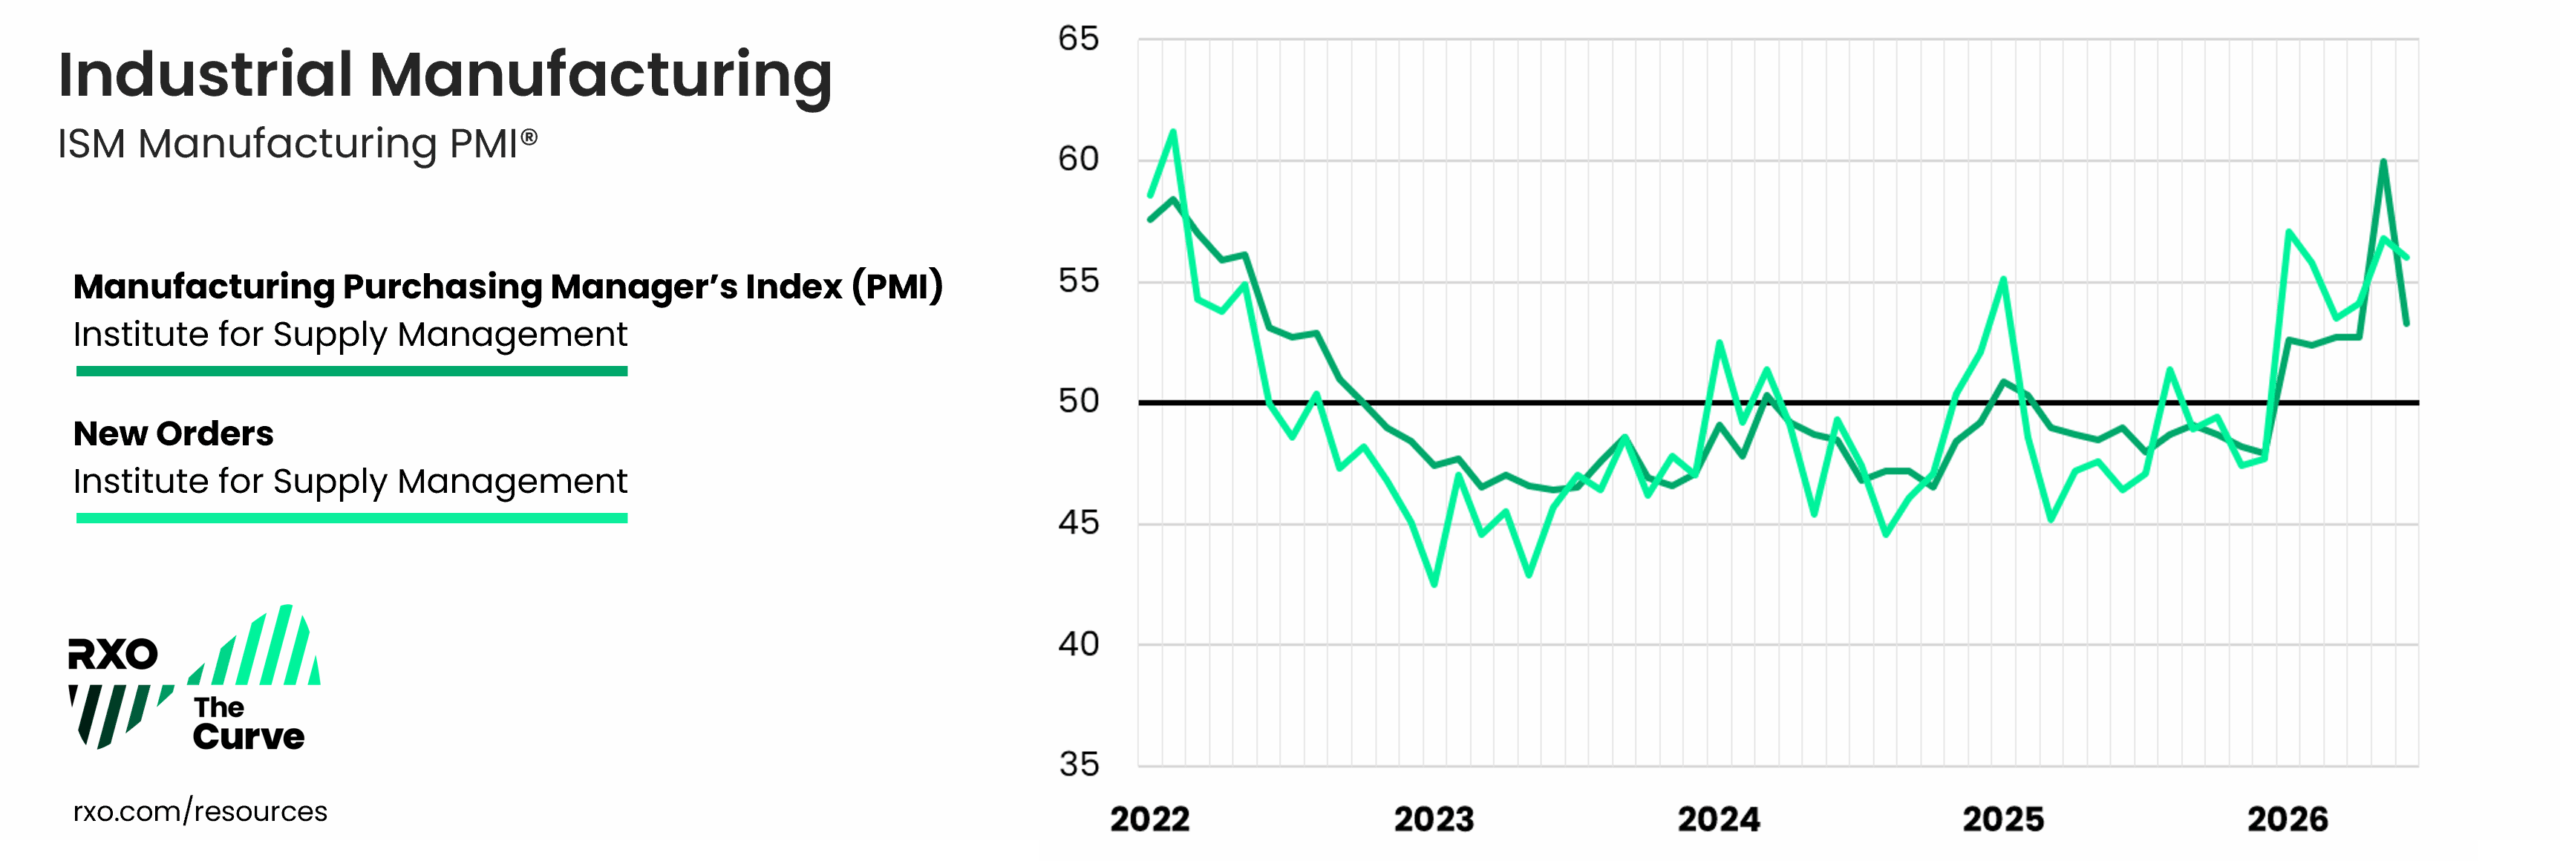
After a prolonged contraction, the industrial sector of the U.S. economy was beginning to show signs of improvement in early 2025. The Manufacturing Purchasing Manager’s Index (PMI) entered expansionary territory in January and February of last year, only to sink back into contraction for the rest of the year, primarily due to tariff uncertainty.
In January 2026, however, the index kicked off to a strong start and broke a long period of contraction, jumping into expansionary territory (above 50).
The strength has persisted, and the index has been in expansionary territory every month this year, hitting its strongest reading in approximately four years in July. Furthermore, the New Orders component of the Index (a leading indicator) has also been in expansionary territory all year.
Overall, the continued relative strength in the industrial economy is a potential bright spot among lagging consumer prices and rising inflation. This could be partially attributed to the rapidly increasing demand for data center construction.
If industrial demand increases even further, the U.S. trucking economy will see increased freight volumes, which, given the current capacity situation, would mean increased spot rates as well.
Key Economic Demand Indicators Driving the Truckload Market
Now that we’ve covered the broader economy, let’s look at some indicators that are most closely linked to truckload market activity.
Overall, we’ve seen relative stagnation in these indicators (with the exception of imports; more on that below), perpetuating the trend of muted truckload volumes, which have, in turn, slowed down a freight market recovery.
Let’s examine the most recent available figures for industrial production, consumer spending, imports and inventories through the lens of how they are impacting truckload shipping.
Download all the Curve charts for your next presentation.
Note: Truckload Market Inflation/Deflation vs. Economic Growth/Recession
It’s worth noting that though the truckload market is linked to what happens in the wider economy, the two are not always coupled.
Given how supply and demand work in the truckload market, it’s possible for the economy to remain strong and the truckload market to languish. It’s also possible for the truckload market to inflate while the economy weakens (see the inflationary Curve in 2008 during the Great Recession).
More specifically, though carriers are combating lagging freight volumes amidst a mixed macroeconomic background, rates are inflating due to an increase in their overall cost structures (labor, insurance, etc.) and a diminished driver pool (more on that below).
Personal Consumption Expenditures
- What is it?
How much the American consumer is spending - How it impacts truckload shipping:
The more we buy, the more we need to produce (IP) and/or buy elsewhere (imports), which translates to greater demand for truckload shipping.
While we’ve had more than three years of persistent inflation and fears of a possible recession, consumer spending has remained stable, helping to buoy the overall economy.
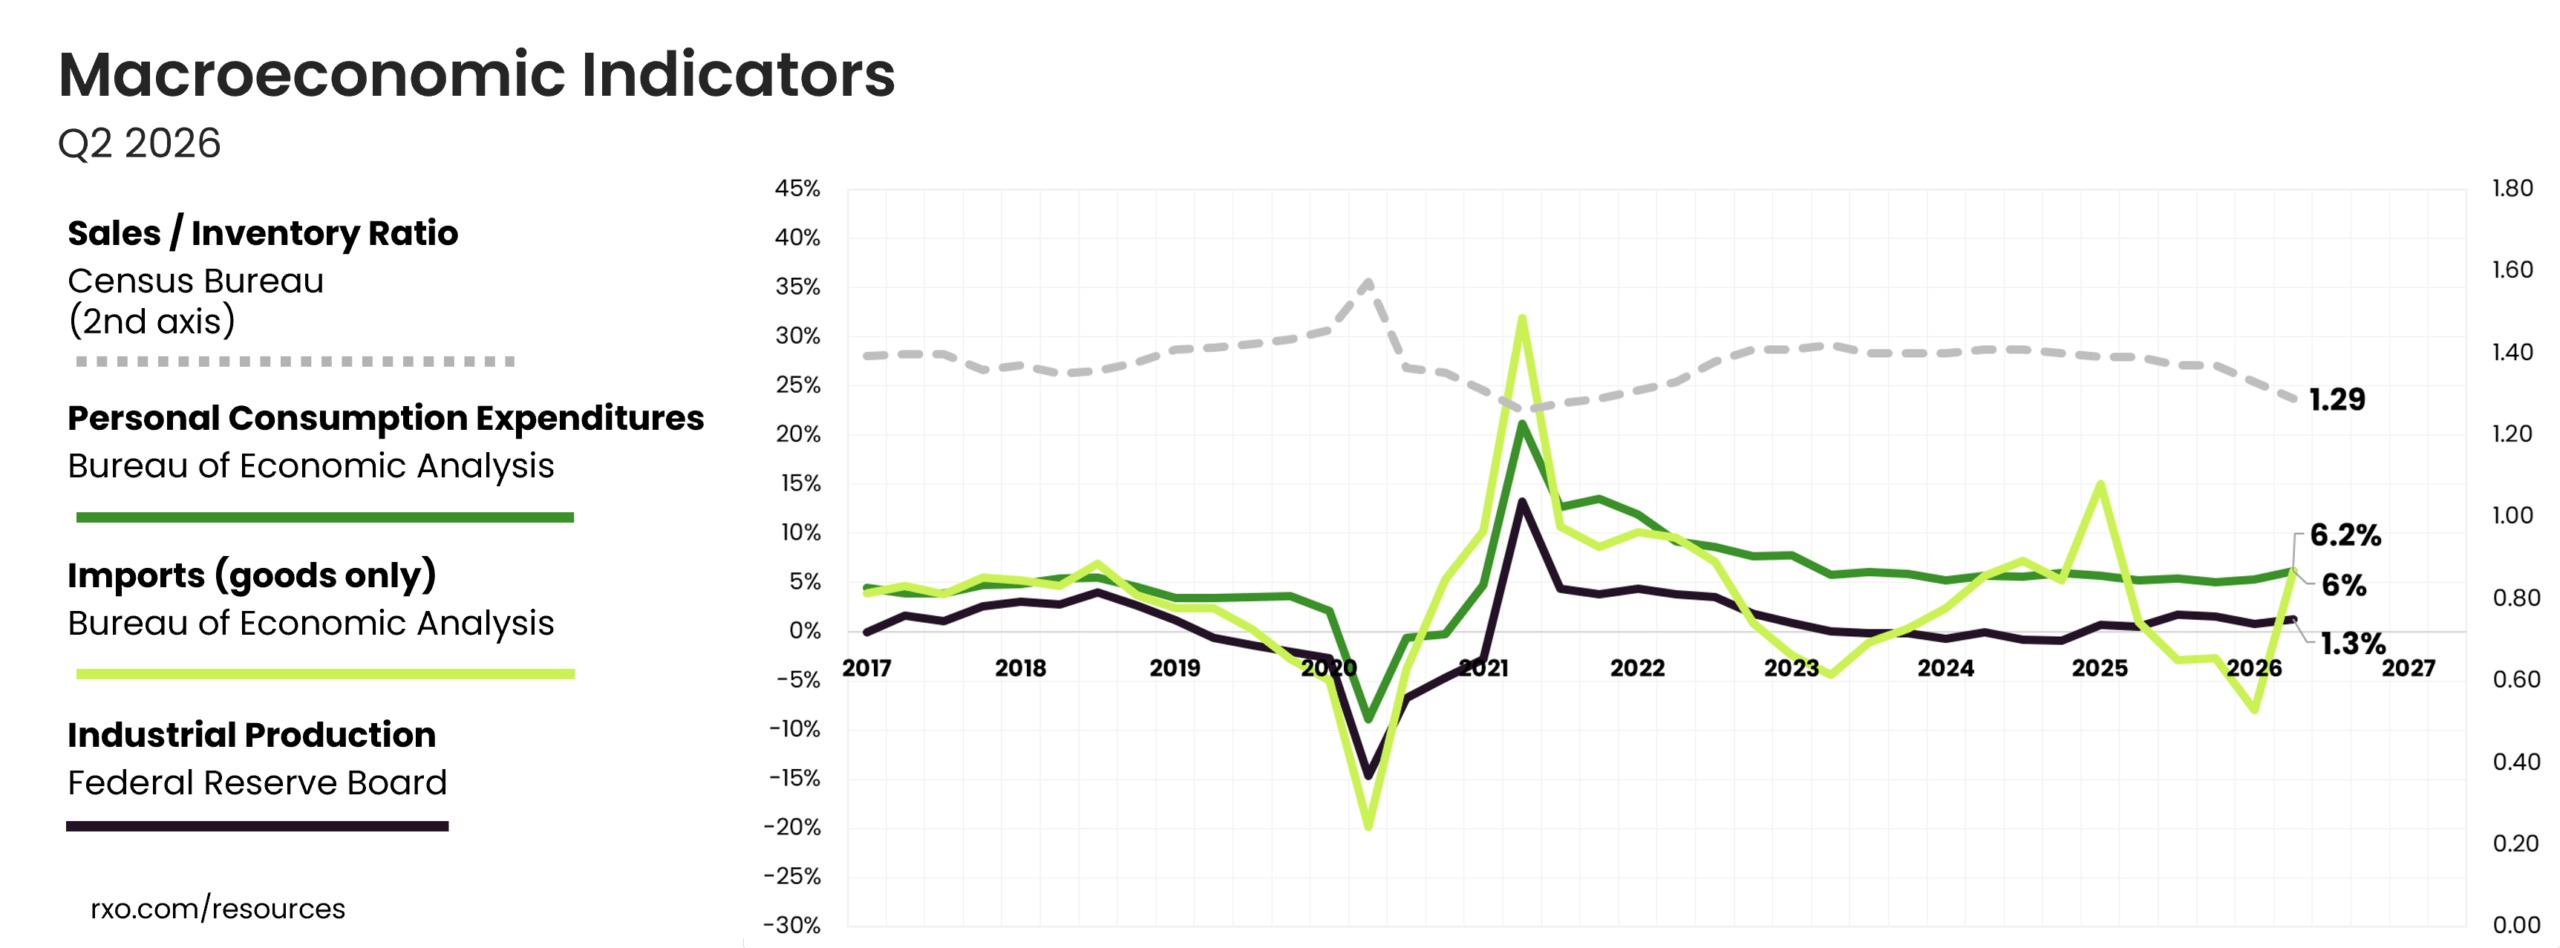
Though the consumer spending growth rate has steadily slowed since Q4 2021, returning closer to the historical average, it is still growing; in Q2 the Personal Consumption Expenditures Index is at 6% year-over-year, up slightly from Q1 (5.3%).
Goods vs. Services in Consumer Spending
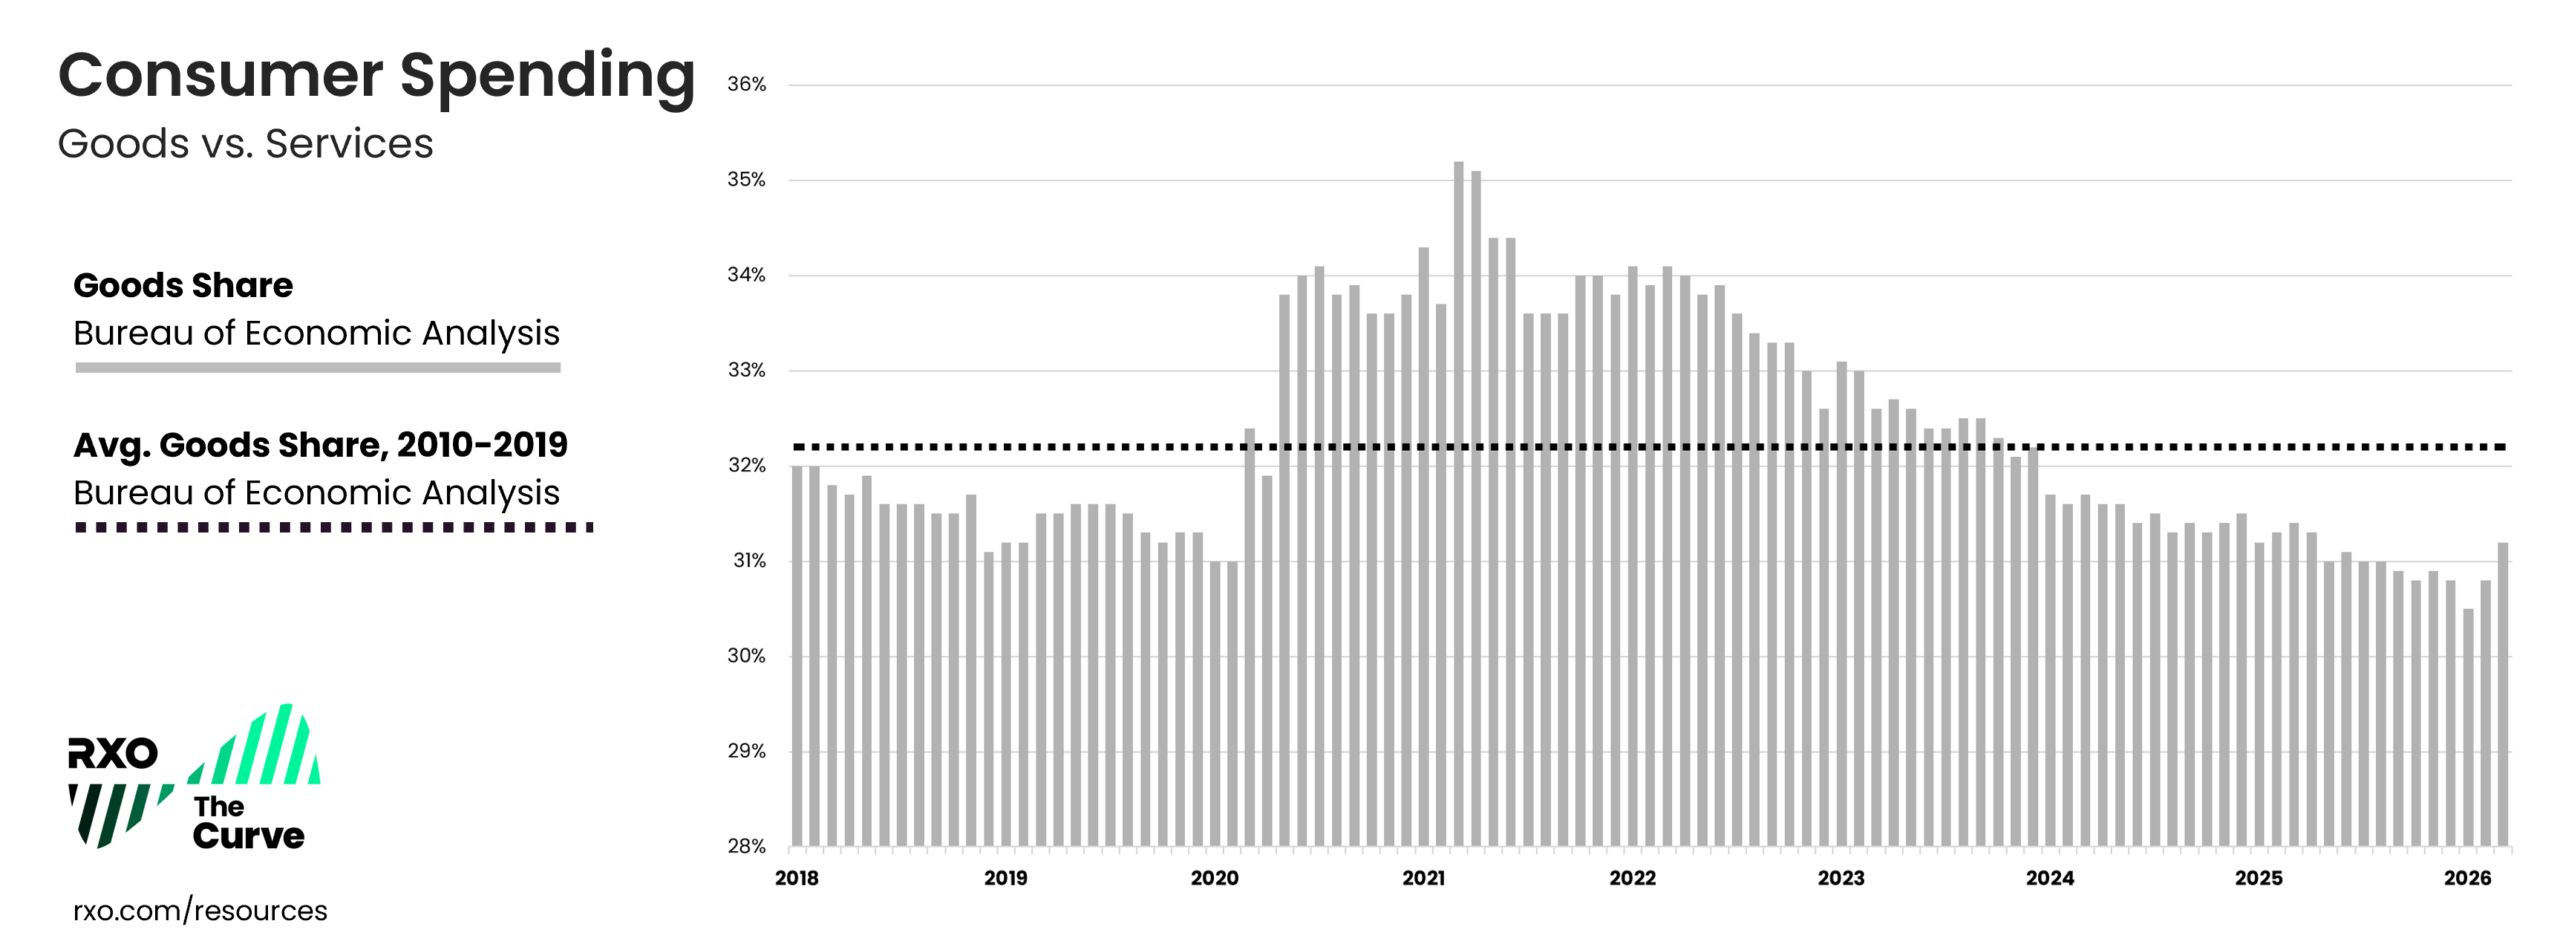
When COVID struck, service-related industries closed and, in turn, demand for physical goods (which require more freight shipping) soared to 15-year highs in an incredibly short period of time, driving a commensurately high inflationary spot market.
Over the past several years post-COVID, U.S. consumers have increased their preference for services (vacations, dining, entertainment, etc.), which has decreased physical goods’ share of wallet, resulting in less freight.
Though the rate of decline for total spending on goods has stabilized, it is still tracking below the baseline average (32%) of the 2010s. We’ll look for any increase in this to drive more freight demand in the future.
Industrial Production (IP)
- What is it?
Total value of physical goods America is producing - How it impacts truckload shipping:
The more we make, the more freight that needs to move, from raw material inputs to finished goods
After remaining in slightly negative territory year-over-year for six consecutive quarters, Industrial Production was positive for all of 2025 and finished the year up 1.6% in Q4.
In Q2 Industrial Production rose slightly to 1.3% year-over-year, compared to 0.8% in Q1.
Imports (Goods Only)
- What is it?
Total value of physical goods America is buying from other countries - How it impacts truckload shipping:
The more we buy from other countries, the more freight that needs to move, from raw material inputs to finished goods
After a short-term increase driven by tariffs (many shippers were scrambling to replenish inventories with non-tariffed goods before updated trade policies set in), this index came back down to earth.
Imports (of goods, excluding services) ended Q4 at -2.7%, declining sharply over the course of 2025.
In Q1 2026, imports dipped even further to -8.0% year-over-year, but rebounded in Q2 to 6.2%, reflecting more favorable year-over-year comparisons, potential restocking efforts, and a trade economy that has somewhat adapted to over a year of trade volatility.
Inventory-to-Sales
- What is it?
The ratio of physical goods businesses have in stock vs. how much they’re selling - How it impacts truckload shipping:
When inventory levels are high, it creates a delay in demand for truckload shipping, as businesses will work off excess inventory before producing new goods (IP) or buying more goods (imports).
After peaking at 1.42 in Q2 2023, the inventory-to-sales ratio has gradually trended down, sitting at 1.29 in Q2 (through May, latest available).
In fact, the ratio has decreased for the past seven consecutive months, with May ending at 1.28; we haven’t seen it that low since November 2021.
With so much economic uncertainty amidst muted consumer demand, shippers have been hesitant to build up big piles of inventory. However, now that inventories are relatively depleted, shippers could launch meaningful restocking efforts ahead of peak season.
To the extent that consumer demand improves, supply chain leaders may need to undertake restocking efforts to rebuild inventory levels (which would result in increased truckload demand).
Macroeconomy & the Truckload Market: Key Takeaways
- Despite continued headwinds over the past three years, the U.S. economy has avoided a recession (at least for the time being), buoyed by stable consumer spending and a strong industrial recovery.
- We are operating in a fluid environment — trade policy, geopolitical unrest, and higher oil prices are driving significant economic uncertainty, which has led to declining consumer confidence and long-term inflation expectations that remain elevated.
- There are a few signs for optimism in the current environment, including a slight increase in manufacturing and the potential restocking of inventories.
- The last time the freight cycle went inflationary (2020 – 2021), surging demand drove rate growth. Demand is not driving this inflationary leg — instead, supply-side constraints (carrier attrition) is the primary force.
- That said, any increase in demand, even modest, would drive further supply chain volatility.
Truckload Market Trends to Watch in Q2 2026
Let’s unpack a few of the key trends impacting the market before we dive into the updated Q3 forecast.
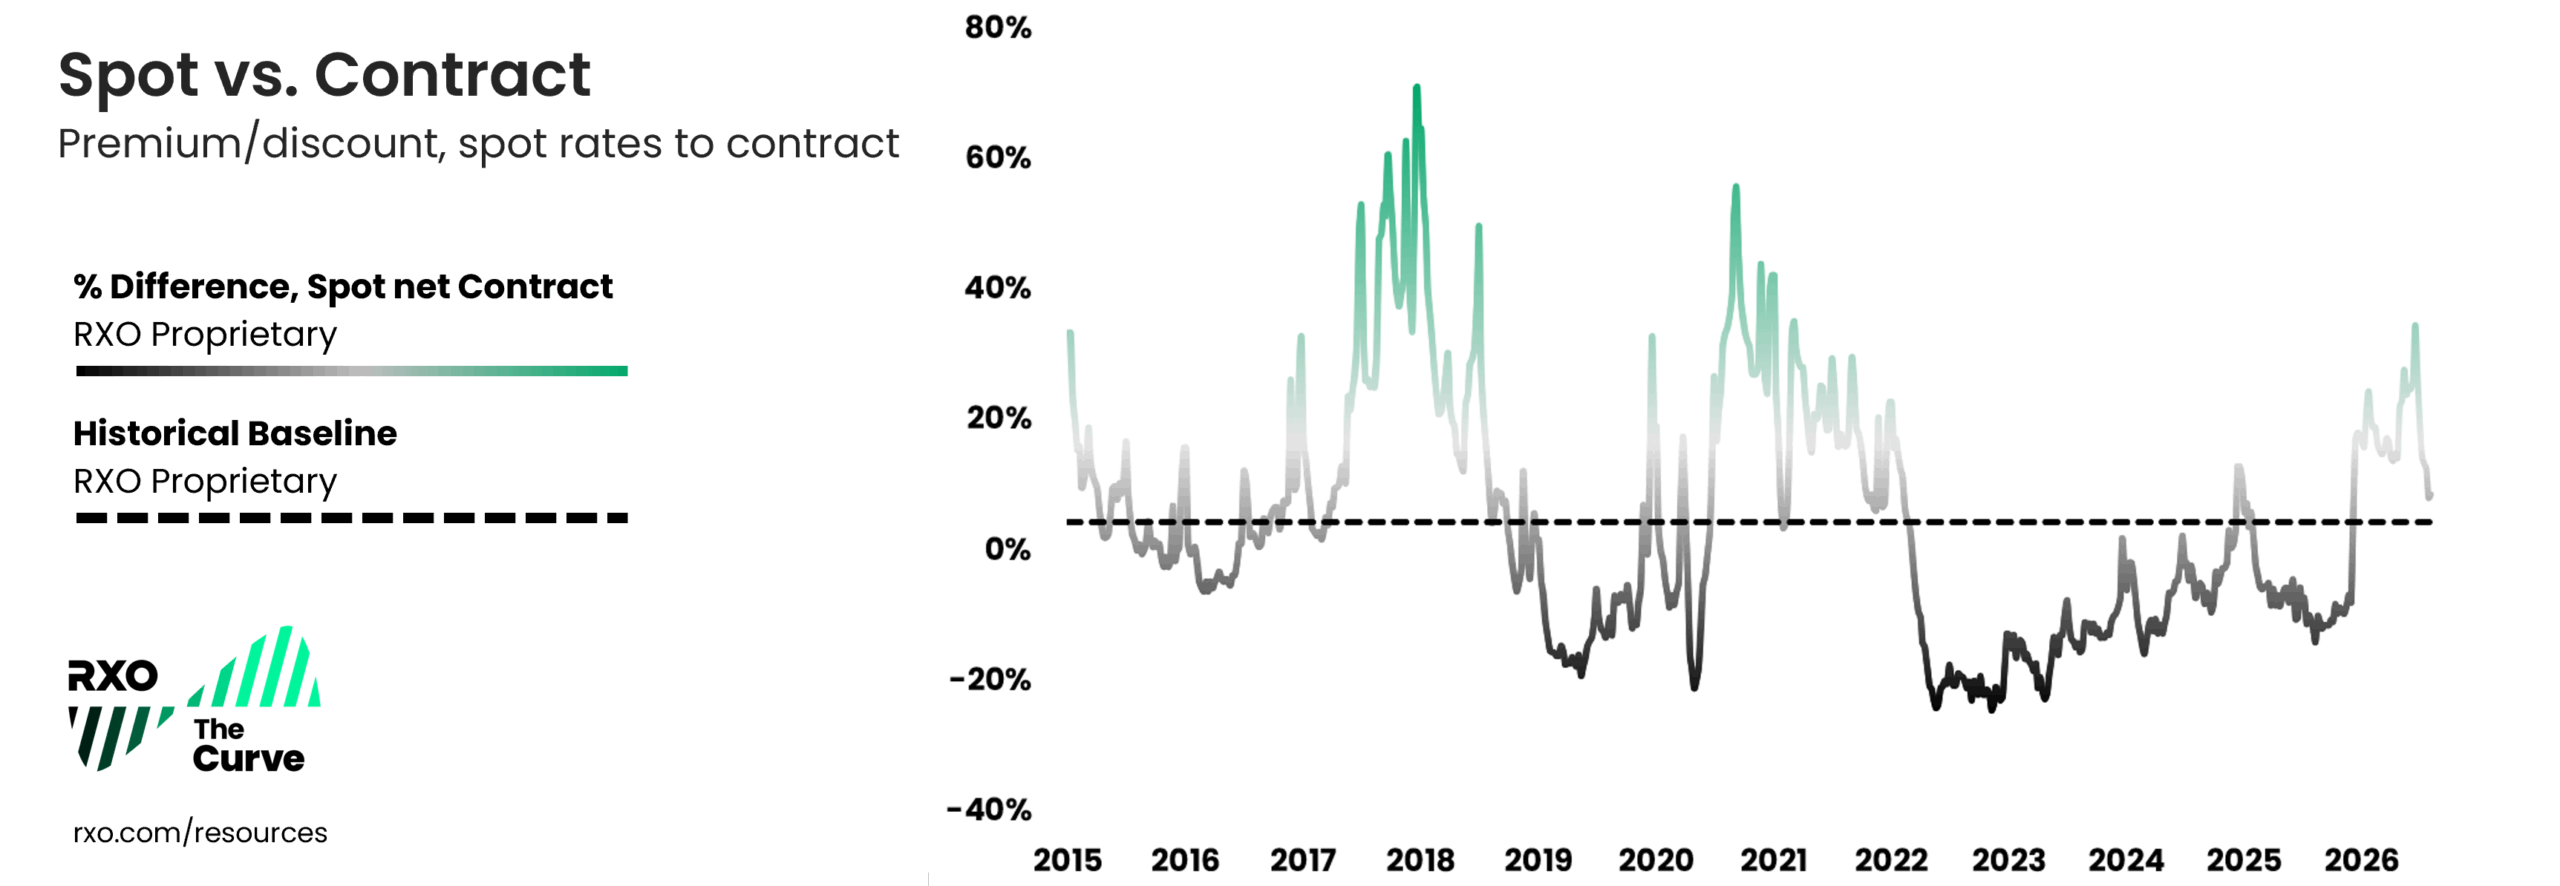
1. Spot rates overtook contract rates — and are holding the advantage.
For the past few years, shippers have used their transportation RFPs as opportunities to bring their contract rates (i.e. primary rates) back towards pre-pandemic levels — and they were largely successful.
Even though spot rates bounced off the bottom in 2023 and have been year-over-year inflationary since early 2024, they were, in absolute terms, unable to consistently overtake contract rates.
That all changed at the very end of 2025, and spot rates have held their advantage throughout the year to date, driven by federal regulatory actions tied to driver eligibility and licensing.
As this dynamic persists, routing guides will continue to deteriorate as contract rates that were set in the softer market remain pressured.
2. Federal policy enforcement has eliminated carrier capacity.
The federal policy initiative to increase enforcement on non-domiciled CDLs (which is primarily aimed at the immigrant driver population) has significantly impacted the carrier market.
Combined with increased immigration enforcement spending in the One Big Beautiful Bill Act, a crackdown on CDL mills, a recent Supreme Court decision, and regulatory actions from the FMCSA and DOT, it has led to a noticeable reduction in the overall driver pool.
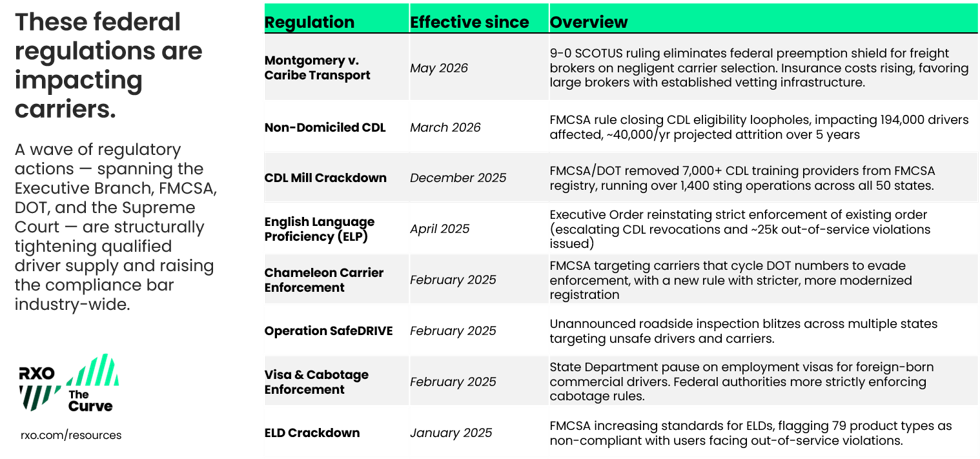
We expect this to continue in the coming months. Let’s briefly unpack what’s going on with the most impactful regulation: non-domiciled CDLs.
Non-Domiciled CDLs
What is a non-domiciled CDL?
In brief, this type of state-issued CDL primarily applies to foreign nationals who are legally in the U.S., but not citizens or permanent residents. Note: This does not apply to Canada and Mexico, whose citizens must obtain their CDL from their home country.
A non-domiciled CDL gives these individuals the opportunity to drive in the for-hire truckload market, provided they complete an application, pass a driving test and provide authorization from U.S. Immigration.
What is happening to non-domiciled CDLs?
The FMCSA issued an interim final rule in late September, that, “Closes gaps in how states issue CLPs and CDLs to individuals from outside of the United States. It tightens eligibility, strengthens safeguards, and makes clear when these licenses must be canceled or revoked, delivering a more secure system and safer roads for all Americans.”
Or to put it simply for our context, it makes it significantly harder (or impossible) for many foreign nationals to drive a commercial vehicle in the U.S.
The FMCSA issued its final rule on February 13, which went into effect on March 16, 2026.
This rule significantly tightens eligibility by requiring specific, vetted employment authorization.
Employment authorization documents alone no longer qualify, and states must verify immigration status through the SAVE system. It also restricts non-domiciled CDLs to certain visa holders.
How much does this affect overall carrier capacity?
The FMCSA estimates that this will push nearly 200,000 drivers out of the market — approximately 5% of the of all active interstate CDL holders.
The massive and highly fragmented U.S. truckload market is notoriously difficult to quantify, particularly the subsection of the driver population to whom this rule applies (i.e., owner-operators and small fleets), so it’s difficult to say exactly how much this will ultimately impact truckload capacity.
However, it is the biggest structural change to the supply side of the truckload market since trucking deregulation in 1980.
How long will it take for the drivers to exit the industry?
While the final rule gives up to five years before the expiration of relevant CDLs, when combined with ramped up immigration enforcement and English Language Proficiency enforcement, it’s likely that many of the drivers in this population have already opted out of the industry.
Another consideration — insurance companies will be far less likely to extend coverage to carriers that employ non-domiciled CDLs, which would effectively push them out of the market regardless of more direct government enforcement.
3. Carrier employment continues to wane.
As freight volumes and rates have been muted over the past three years, so has driver employment.
Looking at employment data from the Bureau of Labor Statistics (BLS) (which only accounts for W2 employees at fleets, not owner-operators), carrier attrition continues, and we can see drivers exiting the market.
All employees, truck transportation
(from the BLS, through June)
- Decreased sequentially for 32 of the past 36 months
- Decreased year-over-year for 38 consecutive months
Production & non-supervisory employees, long-distance trucking
(aka drivers, from the BLS, through May)
- Decreased sequentially for 28 of the past 36 months
- Decreased year-over-year for 37 consecutive months
4. Though spot rates have increased, carriers are still less profitable than prior market peaks.
We’ve spent the last several years in a decidedly shippers’ market. With spot rates running hot for the past six months, the pendulum is starting to swing the other way.
And while carriers are, broadly speaking, in a much better position than they were a year ago, trucking companies are still facing increasing costs across the board: diesel, insurance, cost of capital, and labor.
Though freight rates have recently increased, the cost to operate a truck (excluding fuel) is 29% higher compared to the last market peak in 2021.
Carriers with significant (or complete) exposure to the spot market are faring relatively better today; however, larger carriers with heavier contract freight volumes (mostly at lower rates that were set months/quarters ago) remain under some margin pressure as service and rates are balanced.
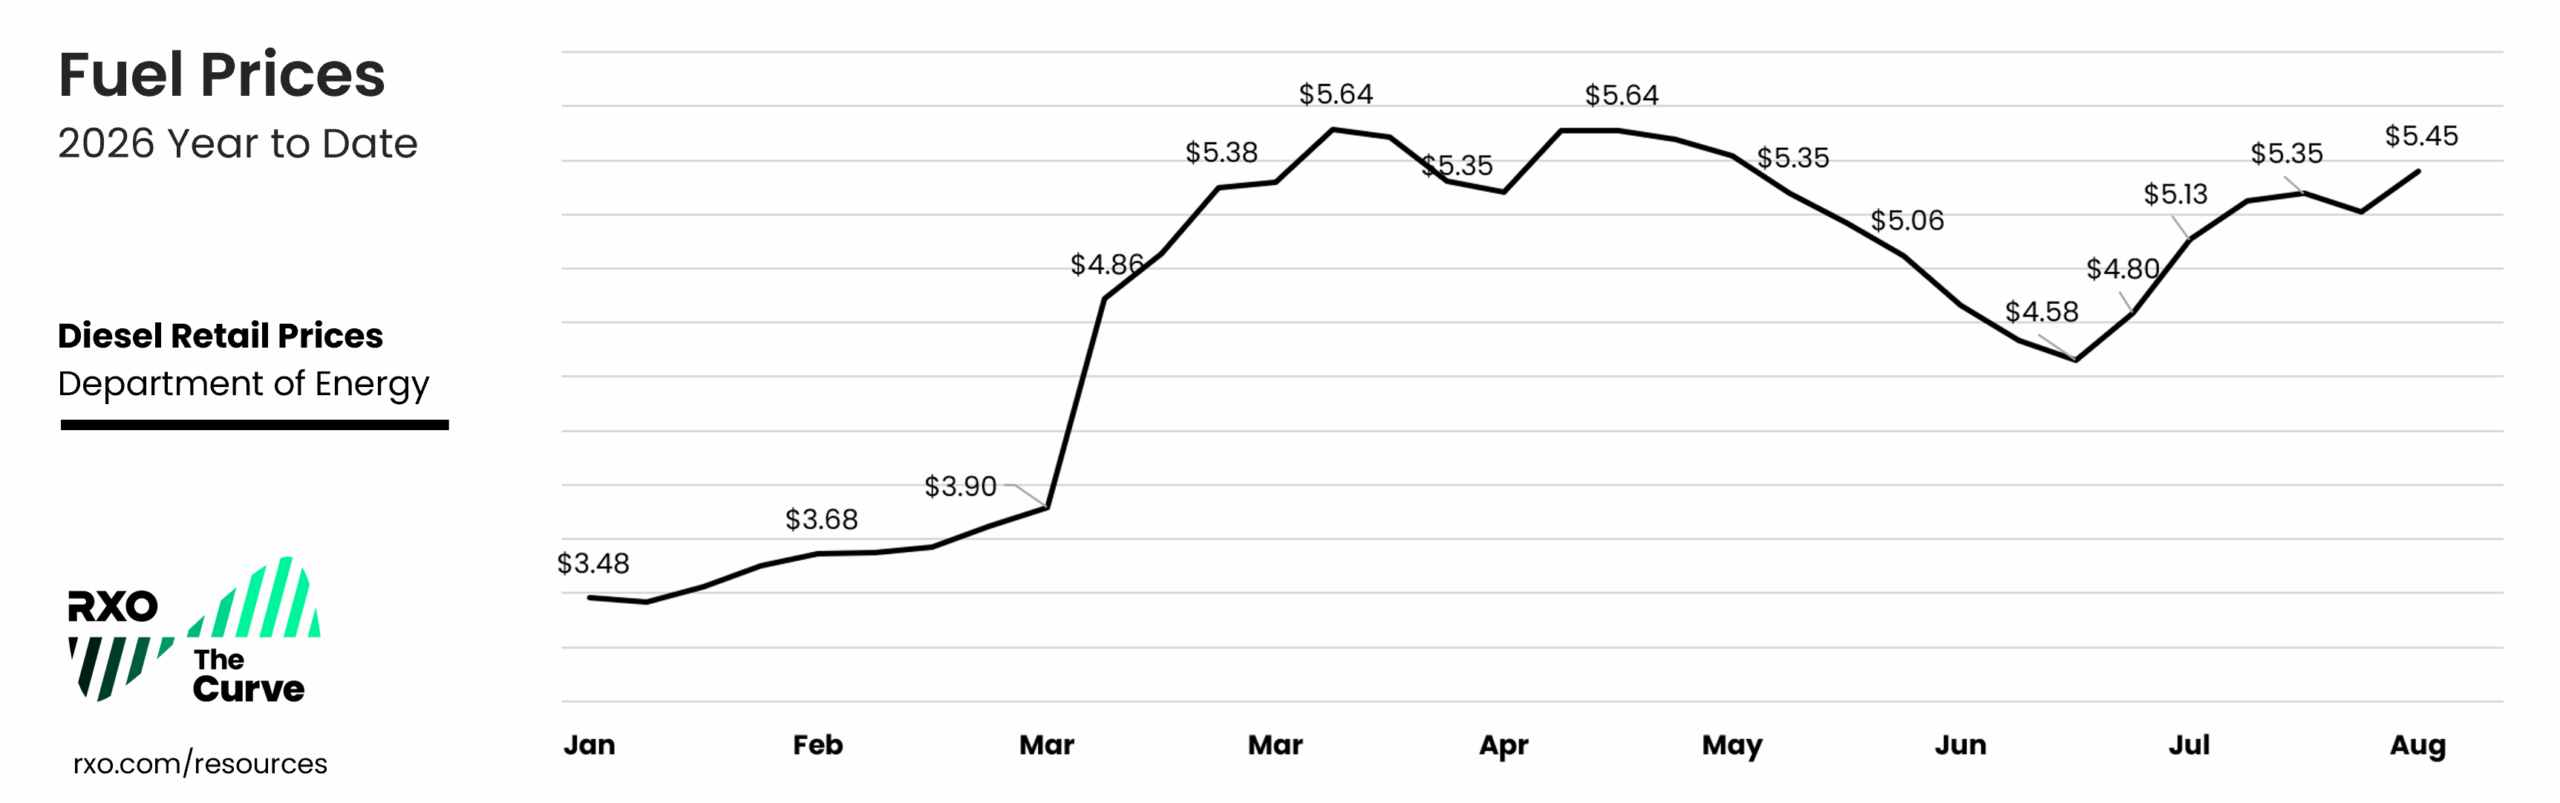
Then there’s diesel, which has risen 54% since the start of the year, and is another inflationary pressure hampering carriers’ profitability.
Though spot freight is generally quoted in real time and with all-in (fuel inclusive) rates, the rate of change in fuel has far outpaced the rate of spot rate inflation.
Widespread routing guide deterioration and even higher spot rates are only being held in check by a muted demand picture.
5. Overall freight volumes remain muted.
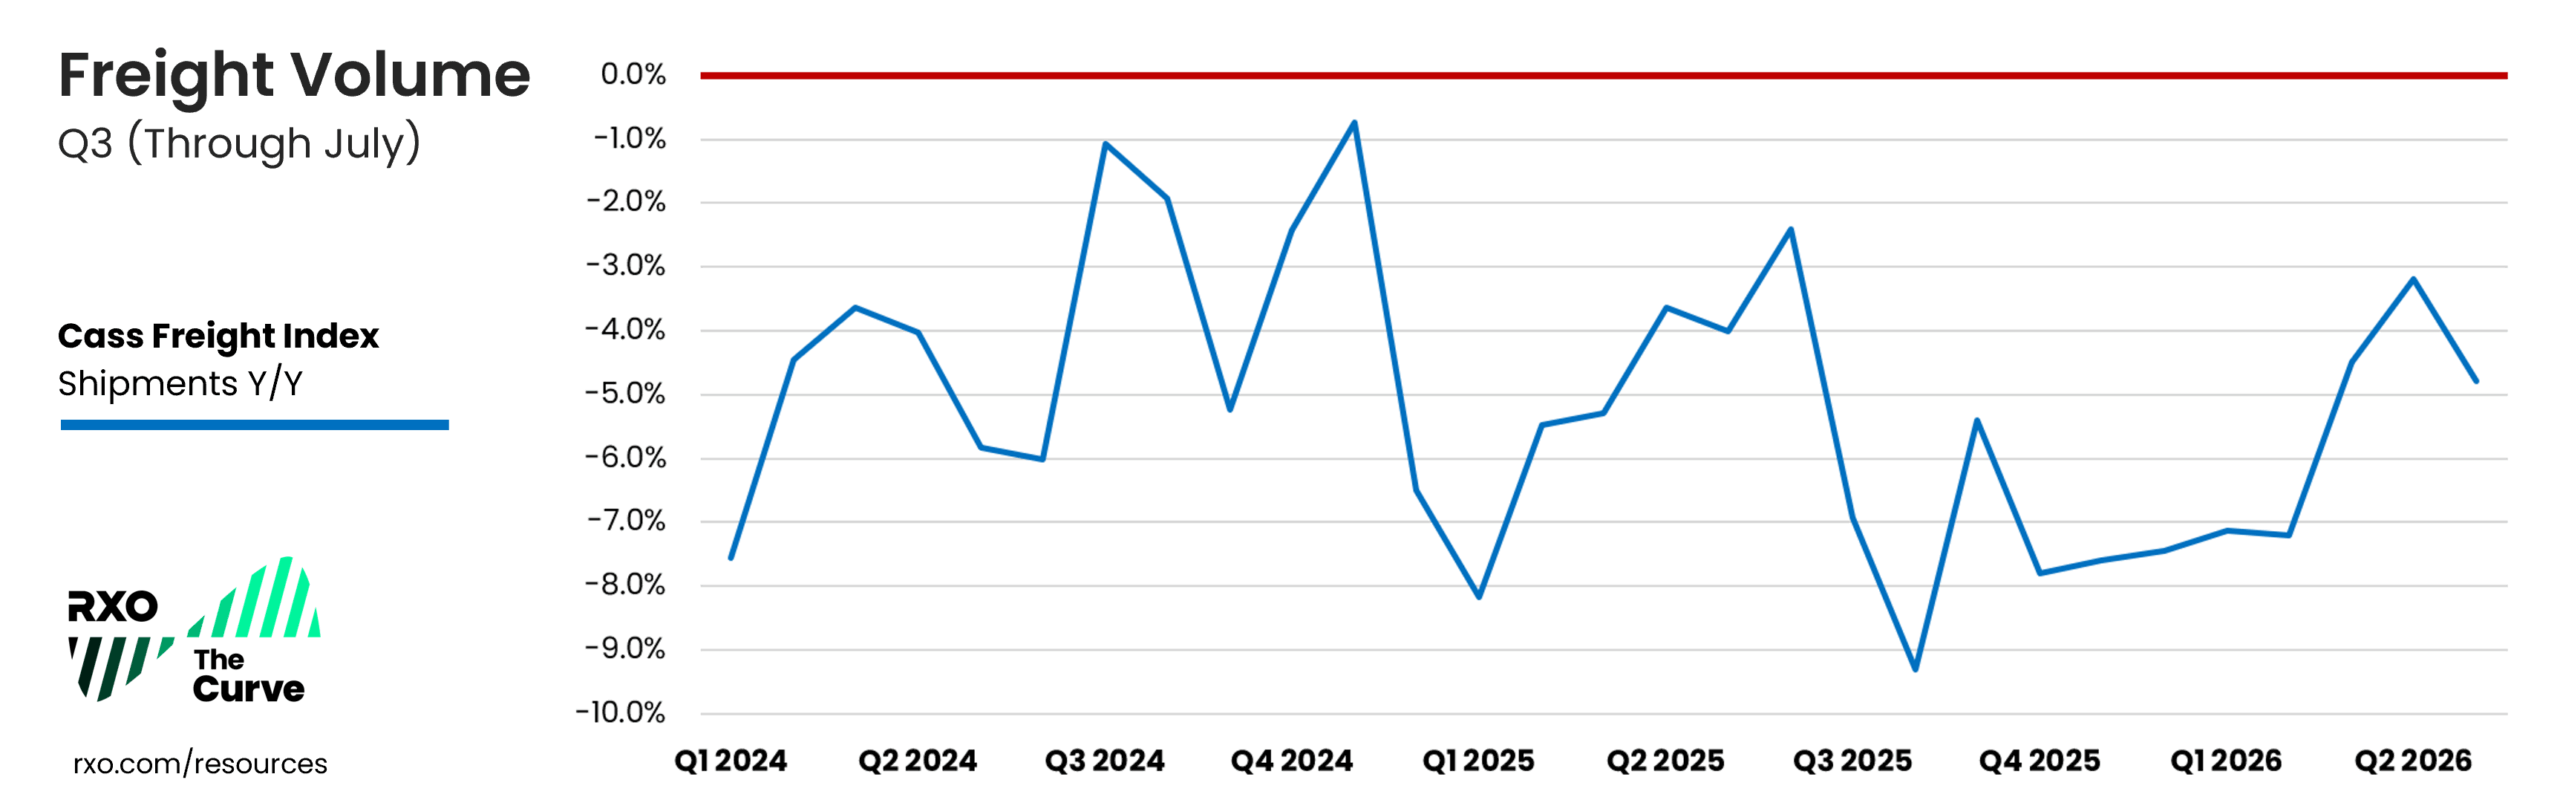
The Cass Freight Index, which measures truckload shipping volumes, has been year-over-year negative for 15 consecutive quarters.
In the second quarter, the Index declined by approximately 3% year-over-year and the rate of change slowed. However, in July, shipments took a step back and declined by 5% year-over-year.
For a sustained move higher in freight demand, we would need to see consumers shift away from services back towards goods and a lower interest rate environment.
6. The supply / demand balance is fragile, and susceptible to any volatility.
We’ve outlined the capacity situation in detail (waning employment, decreasing authorities, pressure on the immigrant driver pool, low rates and low freight volumes).
Accelerated carrier attrition over the past year has taken its toll, setting up a more challenging shipper’s market with increased rate volatility.
Bringing in another data point to support that position, let’s look at the Logistics Manager’s Index, a monthly survey of logistics leaders. Their metric for transportation capacity dropped 2.4% in July to 28.4, which tied, “The capacity reading from April of this year as the second-fastest level of contraction ever observed for any metric in the history of the index (slower only than September 2020’s Transportation Capacity reading of 23.8).”
And though demand has been soft, there are some reasons for optimism including recent industrial production data and lean inventory positions.
Any improvement in truckload volume will likely create widespread capacity disruption.
7. Supreme court ruling on brokerage liability.
The Supreme Court of the United States (SCOTUS) delivered a unanimous ruling on May 14 in Montgomery v. Caribe Transport in favor of Montgomery.
The ruling allows brokers to be found liable for negligent hiring of drivers, which was previously preempted by federal law under the Federal Aviation Administration Authorization Act.
This is an evolving situation, but the ruling is likely to have a negative impact on overall carrier capacity, as brokers will be far less likely to use a marginal carrier (i.e., one without a strong safety rating), which will push those carriers out of the industry.
Any further reduction of the available carrier pool would contribute to increased freight rates.
This market backdrop significantly favors scaled, financially stable brokers that have robust carrier onboarding processes and compliance infrastructure. Smaller brokers may not be able to afford increased insurance premiums, and this ruling is likely to accelerate industry consolidation.
If you’re a shipper, make sure you’re using a large, scaled broker with robust carrier onboarding requirements and strong compliance processes.
Truckload Trends: Key Takeaways
- Freight volumes remain depressed, but spot rates remain higher than contract rates for the second consecutive quarter, and this will persist in the months to come.
- Federal policy enforcement targeting non-domiciled CDLs and other transportation regulations have significantly tightened the driver market.
- Rates have been on a steep upward climb — the level to which that continues will depend on whether we get an increase in freight demand.
- The capacity situation is much more fragile than at any point since 2022.
Q3 2026 Truckload Market Forecast
We’ve covered the macroeconomic environment, and key trends — but where does it leave us going forward?
We predict the Curve will continue its move into inflationary territory.
We’re in a very different shipping environment than at this point last year, and the carrier market is in a much more precarious place than it has been over the last few years.
Industry-wide tender rejections remain at their highest levels since 2022 and rate volatility outpaced seasonality.
That trend continues in Q3, and with peak season right around the corner, it isn’t likely to slow down anytime soon.
2026 Outlook
Though there has already been a significant impact, we expect carrier capacity to continue leaving the market with the full enforcement of the FMCSA Final Rule on non-domiciled CDLs in addition to other regulatory actions.
As stated previously, we believe this represents the biggest structural change to the U.S. carrier market since industry deregulation in 1980 — much more than the ELD mandate in 2017.
Though contract rates slightly increased year-over-year in Q2, spot rates are still rising at a faster rate. As the gap remains between the two, it will drive continued volatility as cash-strapped carriers look to increase profitability after a very difficult three years.
If we have a continuation of current capacity trends with an improvement in demand, shippers’ contract rates will be forced to reset even higher, to maintain service and routing guide compliance.
And there are a few reasons to be optimistic heading into this peak season. Major big box retailers are reporting sustained growth in same-store sales (though moderating, it’s still in line with wage growth), inventory positions remain healthy, and imports have been resilient, with the Port of Long Beach having one of its busiest months in five years.
If demand follows typical seasonality, we would expect even further rate volatility to close out 2026.
Q3 2026 Forecast: Key Takeaways
- We are in a tight capacity market, and the peak season of the year is approaching.
- The Curve index will remain in year-over-year inflationary territory and finish Q3 higher than Q2.
- Though both the U.S. consumer and shippers may be hesitant, there are some reasons for optimism including a robust industrial economy and improving import volume.
- We’re already in a fragile shipping environment, and any increase in demand will drive rates and volatility even higher.
The Q3 2026 Truckload Market Trends Infographic
Next Steps: Get Your KPIs in Order With the Research
Did you know that 99% of carriers take shippers KPI expectations into account before agreeing to move a load with them?
As we head deeper into an inflationary market, it’s the perfect time to check yours up against industry standards.
The latest edition of our original, independent research study on logistics KPIs is loaded with insights and benchmarks, informed by 1,000 shippers and carriers.
Check out the research study now to start having a more data-driven network.