Logistics Key Performance Indicators, also known as KPIs.
These critical metrics enable logistics pros to evaluate network performance, identify problems, drive strategic decisions and maintain healthy relationships with freight providers.
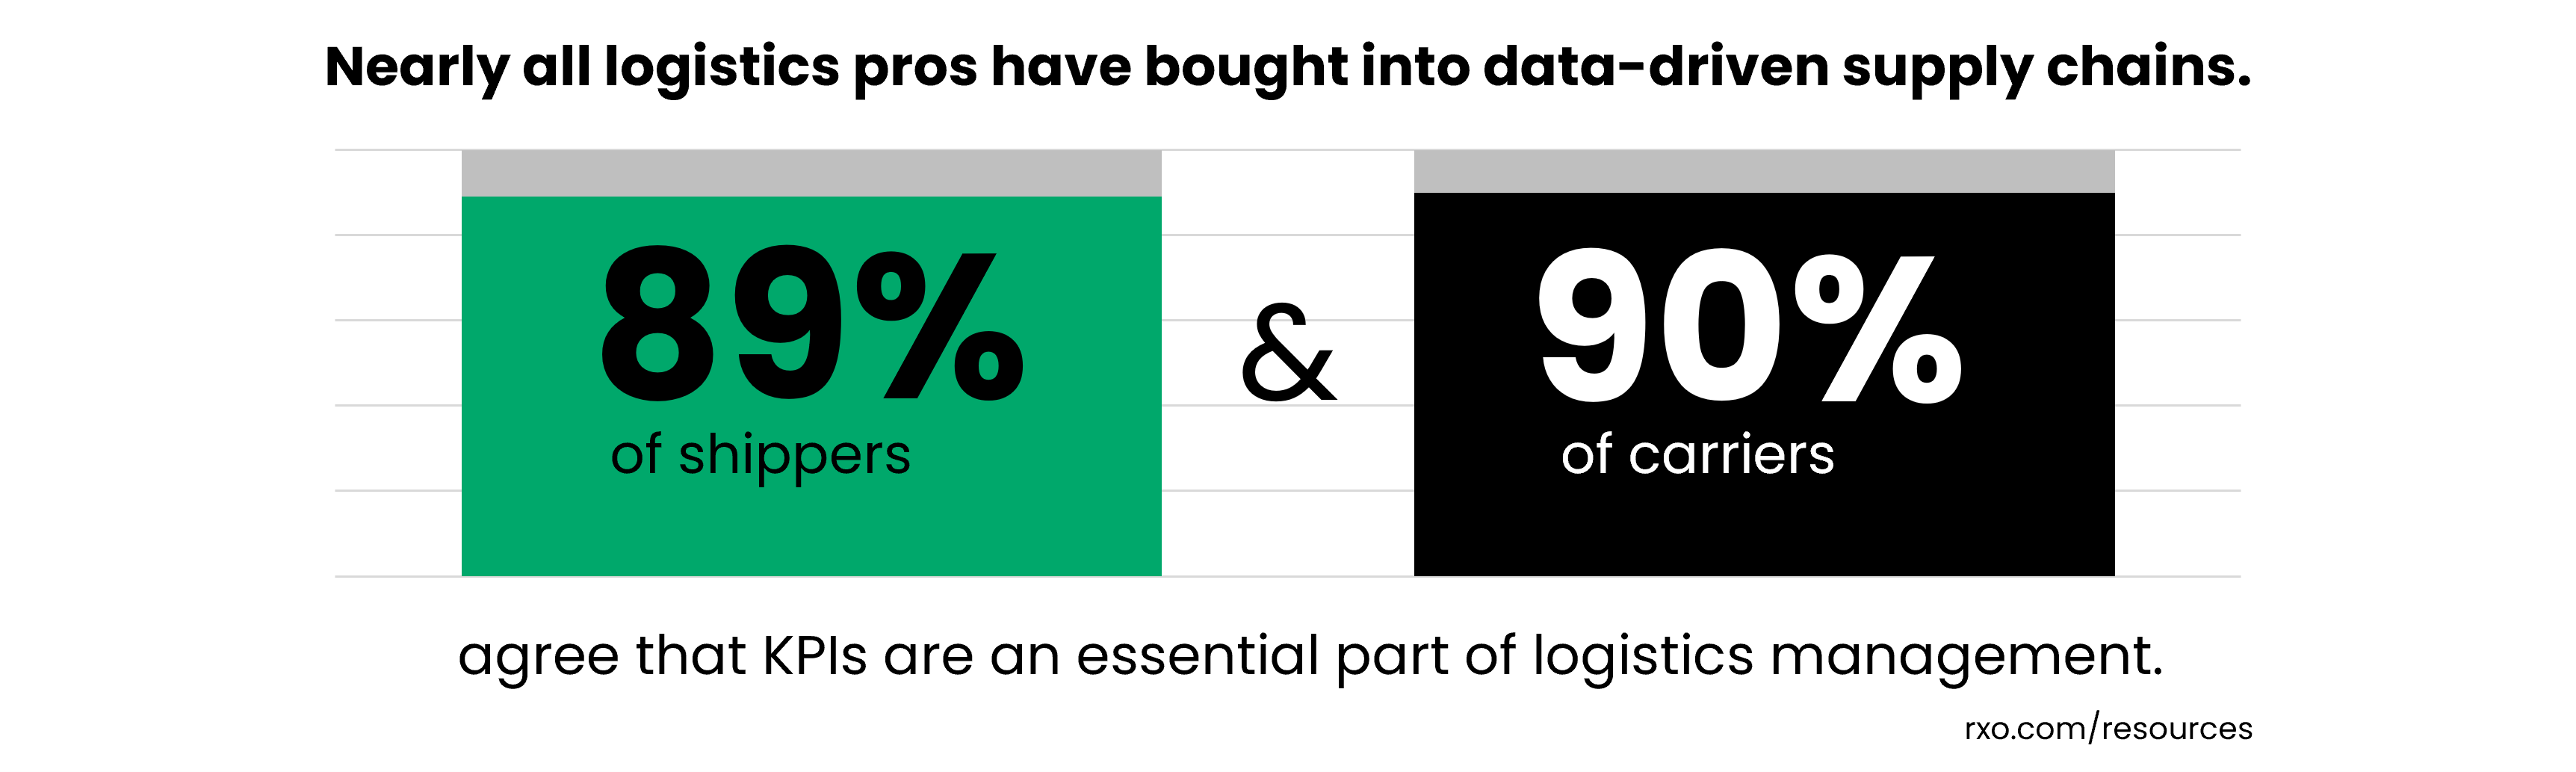
And they are critical — 89% of shippers and 90% of carriers agree KPIs are a crucial part of sound logistics management.
But just because they’re important doesn’t mean they’re easy to manage. How do you know if you’re in-line with industry standards?
Welcome to the second edition of The Logistics Professional’s Guide to KPIs.
This is an independent, original research study filled with trends and charts informed by 1,000 logistics decision makers — ready to get insights you can use to benchmark your own supply chain strategy?
Below, you’re going to learn what shippers and carriers really think about transportation metrics, including:
- How shippers are managing their KPIs
- What role technology and AI are playing
- Which KPIs matter most
- Industry performance standards and how they’ve shifted since 2022
- How carriers are managing their KPIs
- Insights for working with freight providers
- The top trends in logistics KPIs
- Deeper dive: breaking down the results by industry
Prefer to read as a PDF? Want slides for your next presentation?
You can download a PDF version of this study below.
Find this interesting? Please share and post. You can also download the charts as slides for your next presentation.
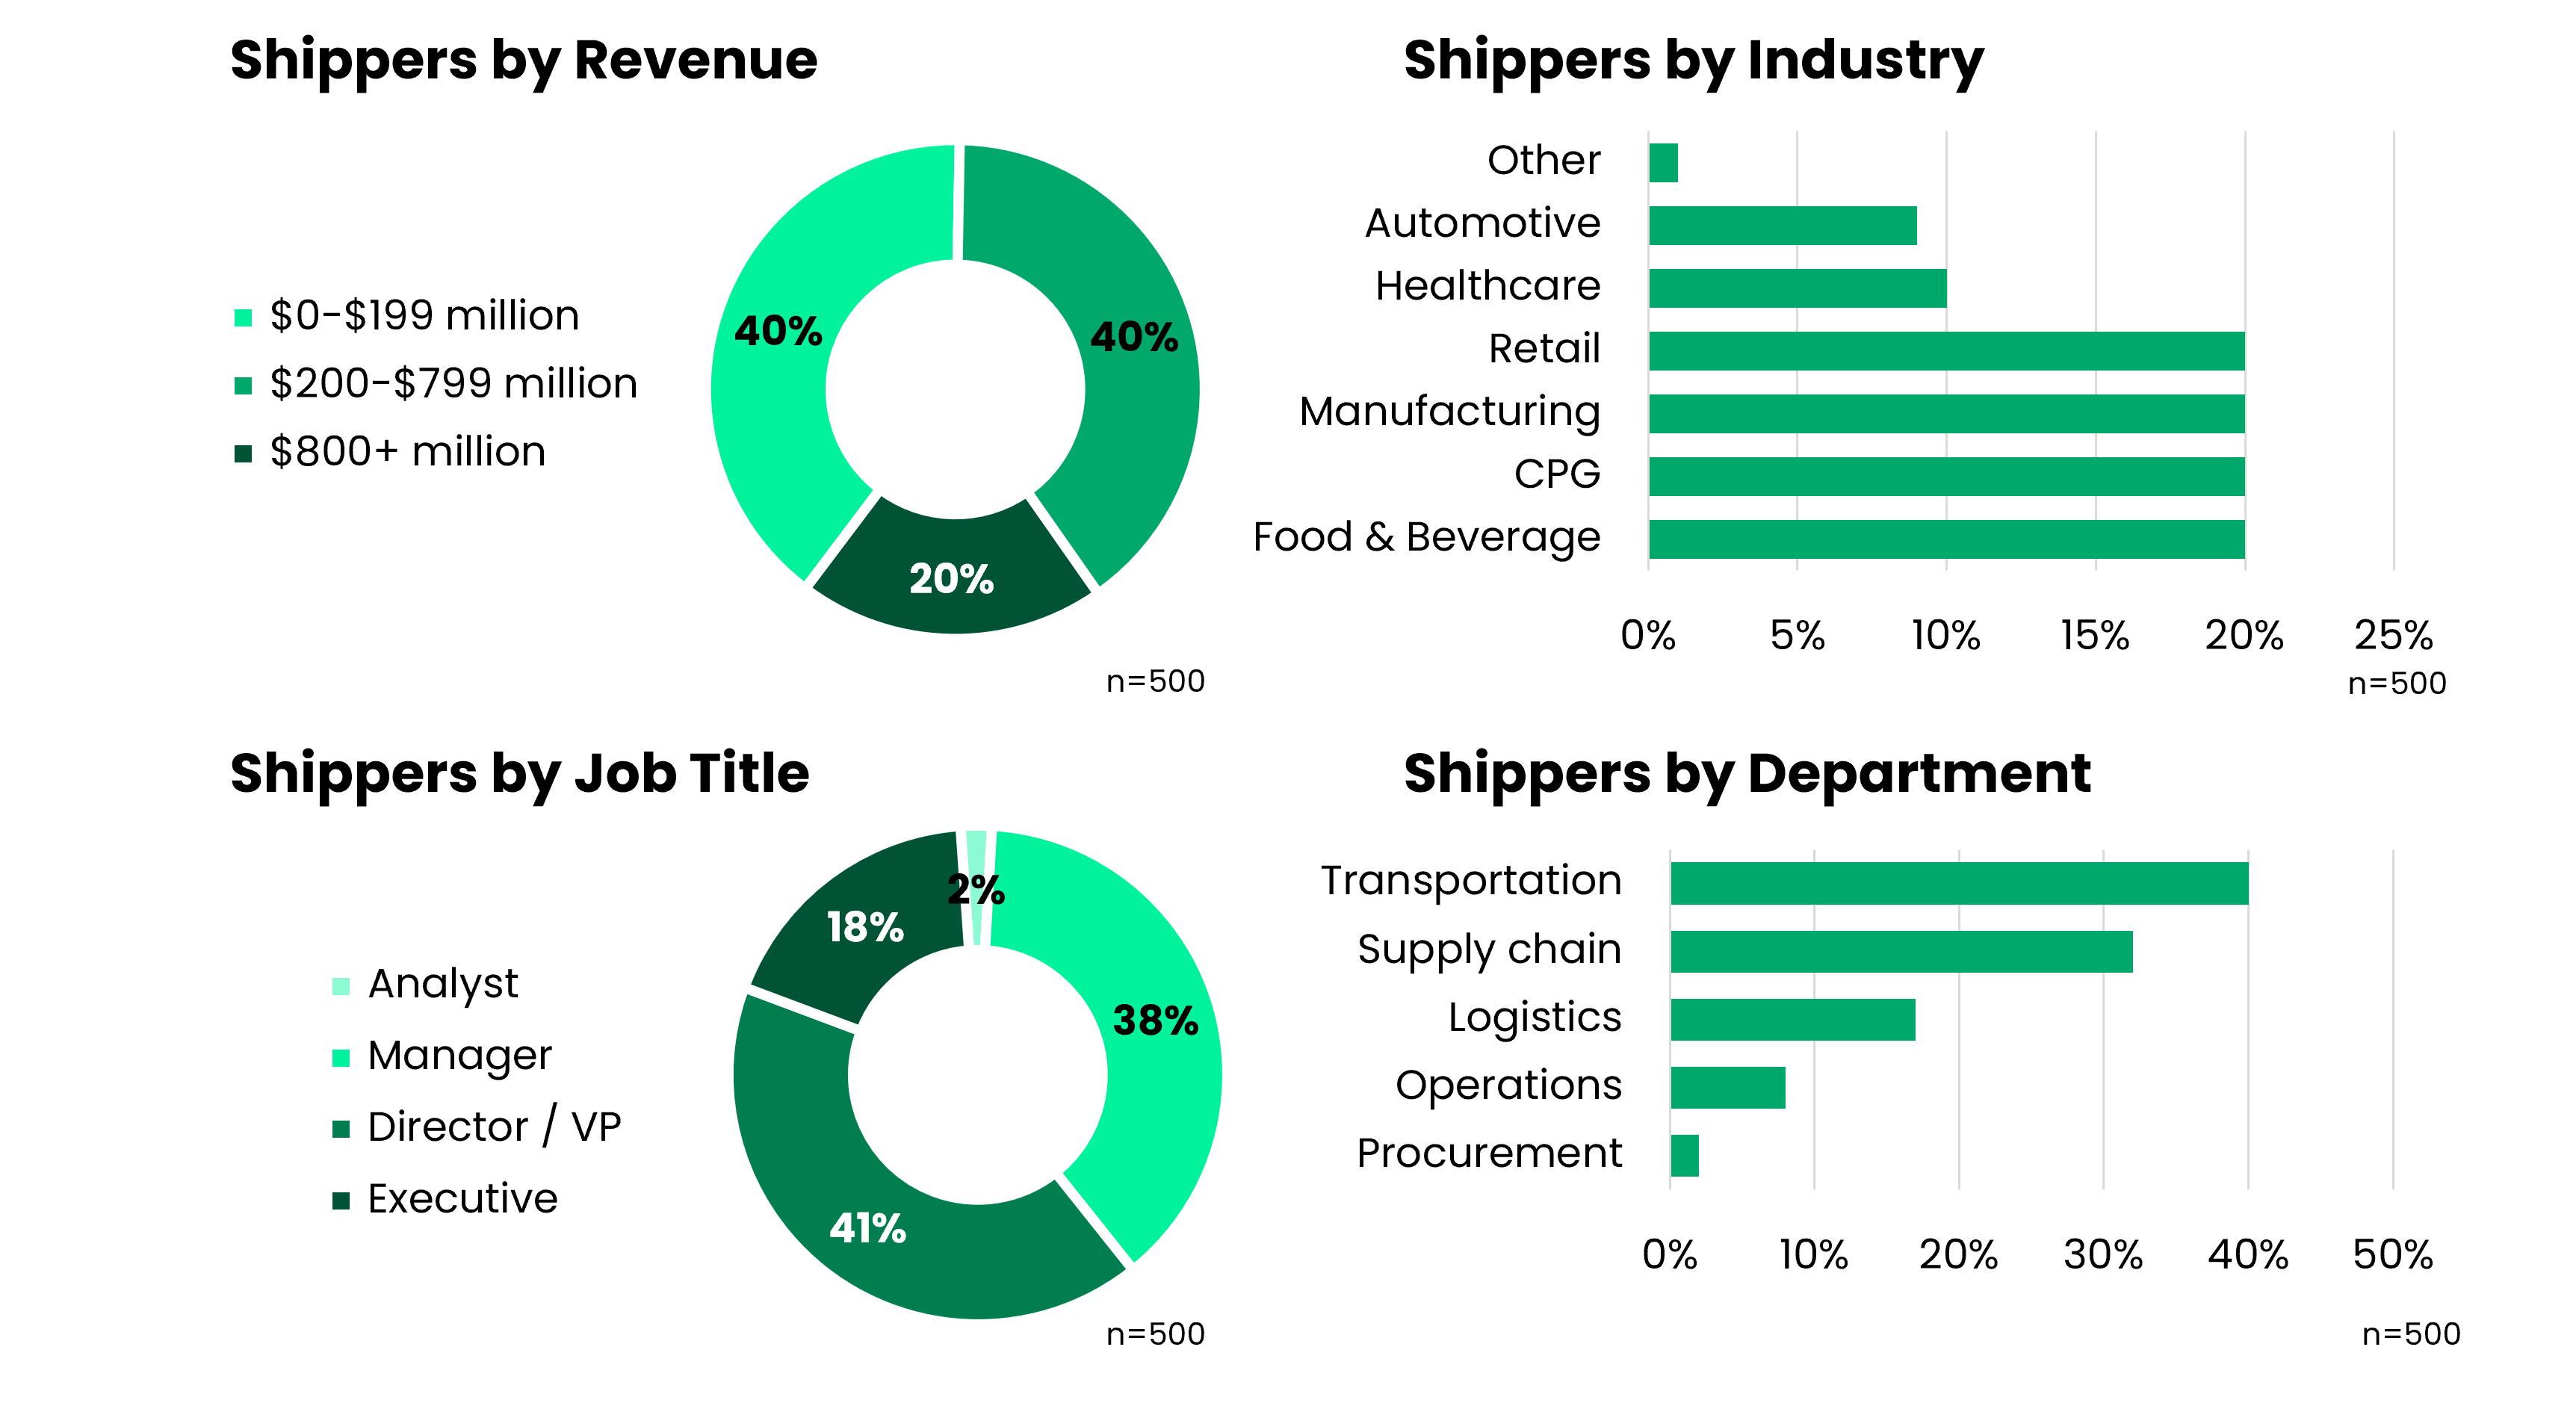
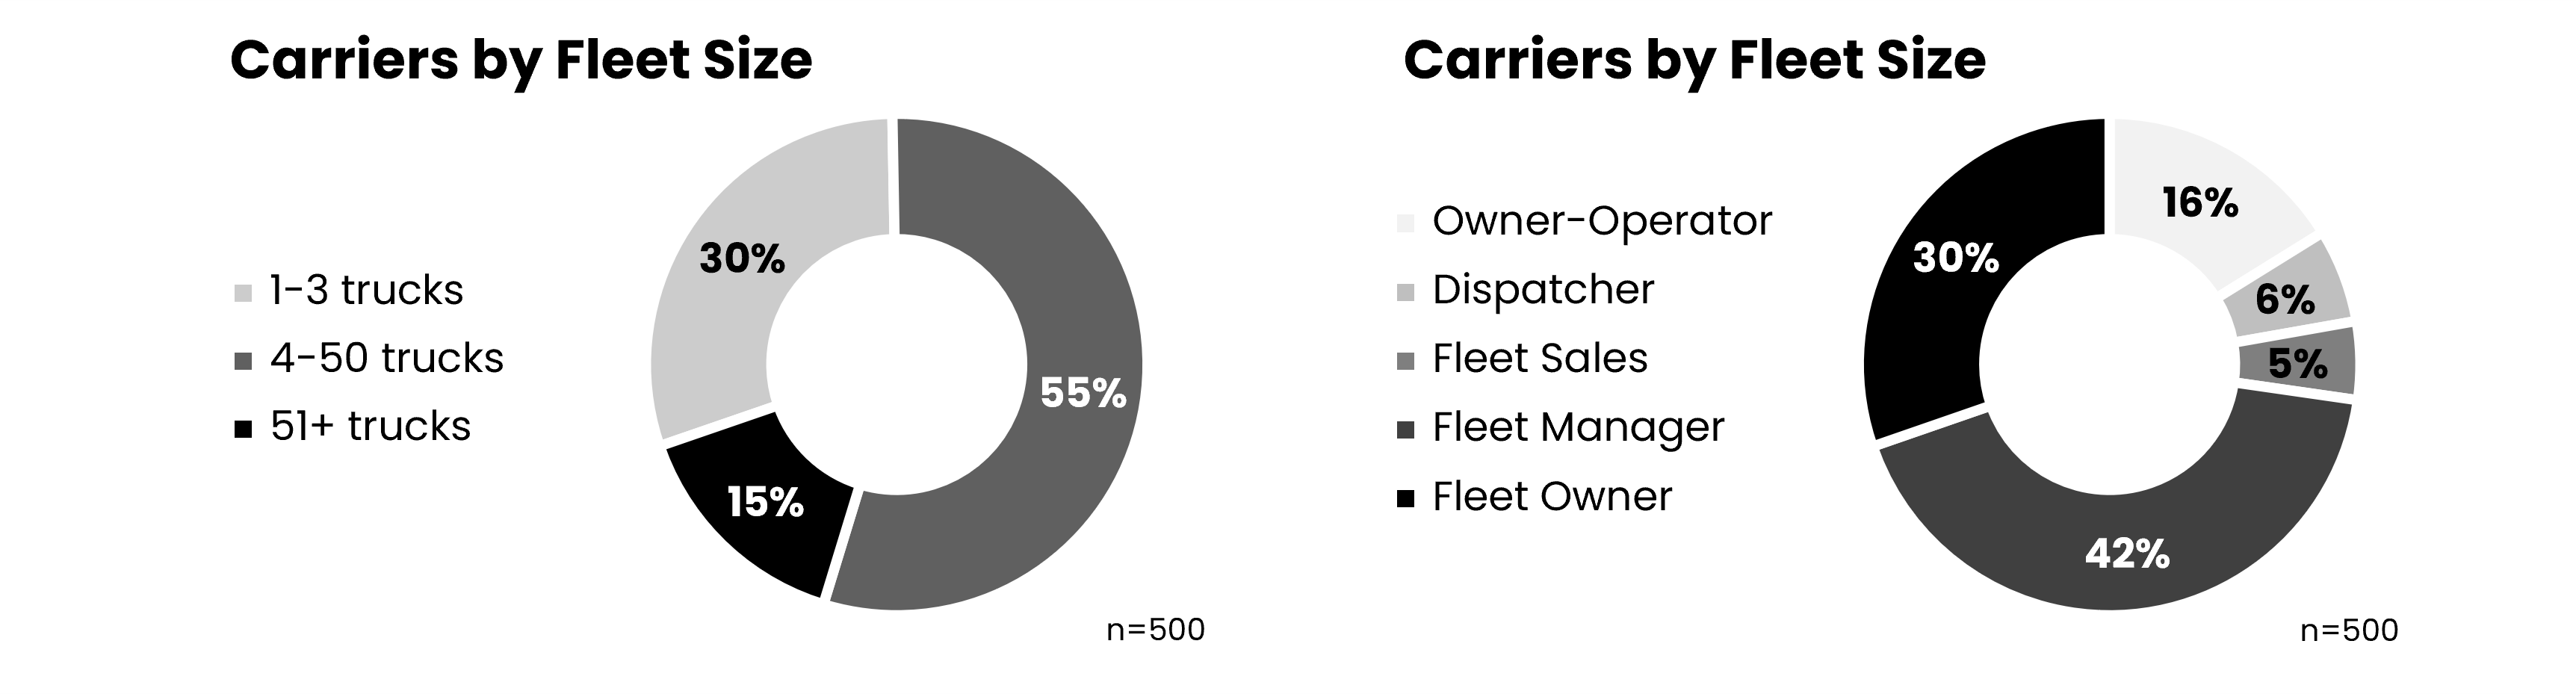
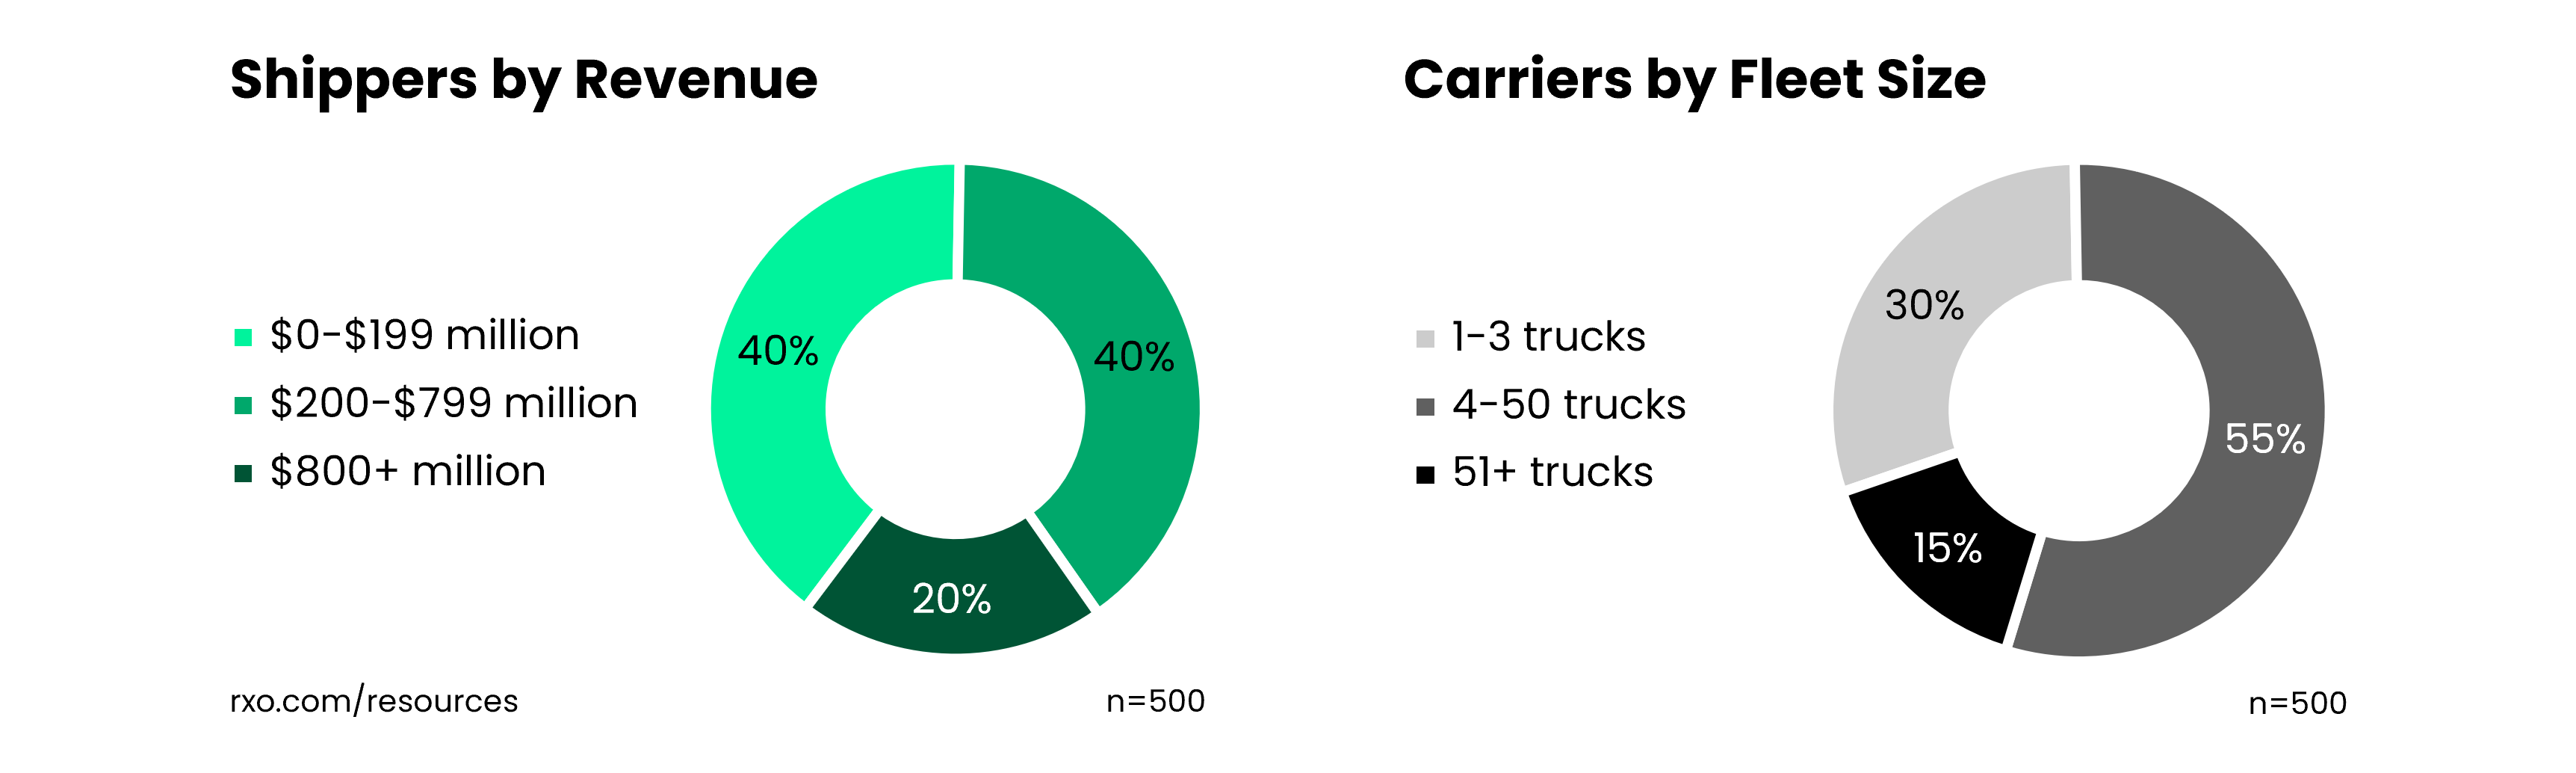
Who We Talked to: Study Demographics
Any comprehensive analysis on the current state of logistics KPIs must account for everyone in the shipping process — manufacturers, distributors, retailers and freight providers.
To answer the core questions around transportation performance metrics, we worked with Qualtrics, to source an independent panel of 1,000 North American logistics professionals — this includes 500 shippers (companies with freight to move) and 500 carriers (for-hire trucking companies).
Respondents ranged across business type, industry vertical, geography and company size.
You can view the full respondent demographics at the end of the study.
You can also view a deeper dive comparing the results by industry.
Let’s find out what they have to say about how data is driving their supply chains.
The State of Logistics KPIs: From 2022 to Today
In 2022, logistics professionals were emerging from the most volatile environment in history — never before had there been a greater focus on the importance of freight shipping.
For better (and for worse), “supply chain” was a topic of constant conversation at both kitchen tables and in boardrooms.
To bring insight into rapidly shifting standards and expectations, we set out to benchmark the benchmarks, conducting the inaugural version* of our independent logistics KPI research.
*The 2022 version of the study was created by Coyote Logistics, who is now a part of RXO.
Three years have passed, and the landscape looks very different. Where backlogs and disruptions were common, now stable rates and ample carrier capacity are the norm.
The rapid, pandemic-fueled technology adoption has not only stuck in supply chains, but accelerated — an industry that was traditionally a pen-and-paper laggard is looking increasingly digital.
How has a shifting supply-and-demand balance coupled with ever-more technology impacted shipper and carrier expectations? Is the market more unified, or more divided?
And how should you prepare your transportation network for the next market cycle?
We answer those questions and more with an updated quantitative analysis of how businesses like yours are setting their performance standards.

The Shipper’s Perspective:
How Businesses Are Managing
Their Logistics KPIs
First, let’s answer a critical question: how important are KPIs in logistics and transportation?
According to 500 shippers, the answer is: very. Not only are KPIs important, they are becoming increasingly essential as supply chains become more data-driven.
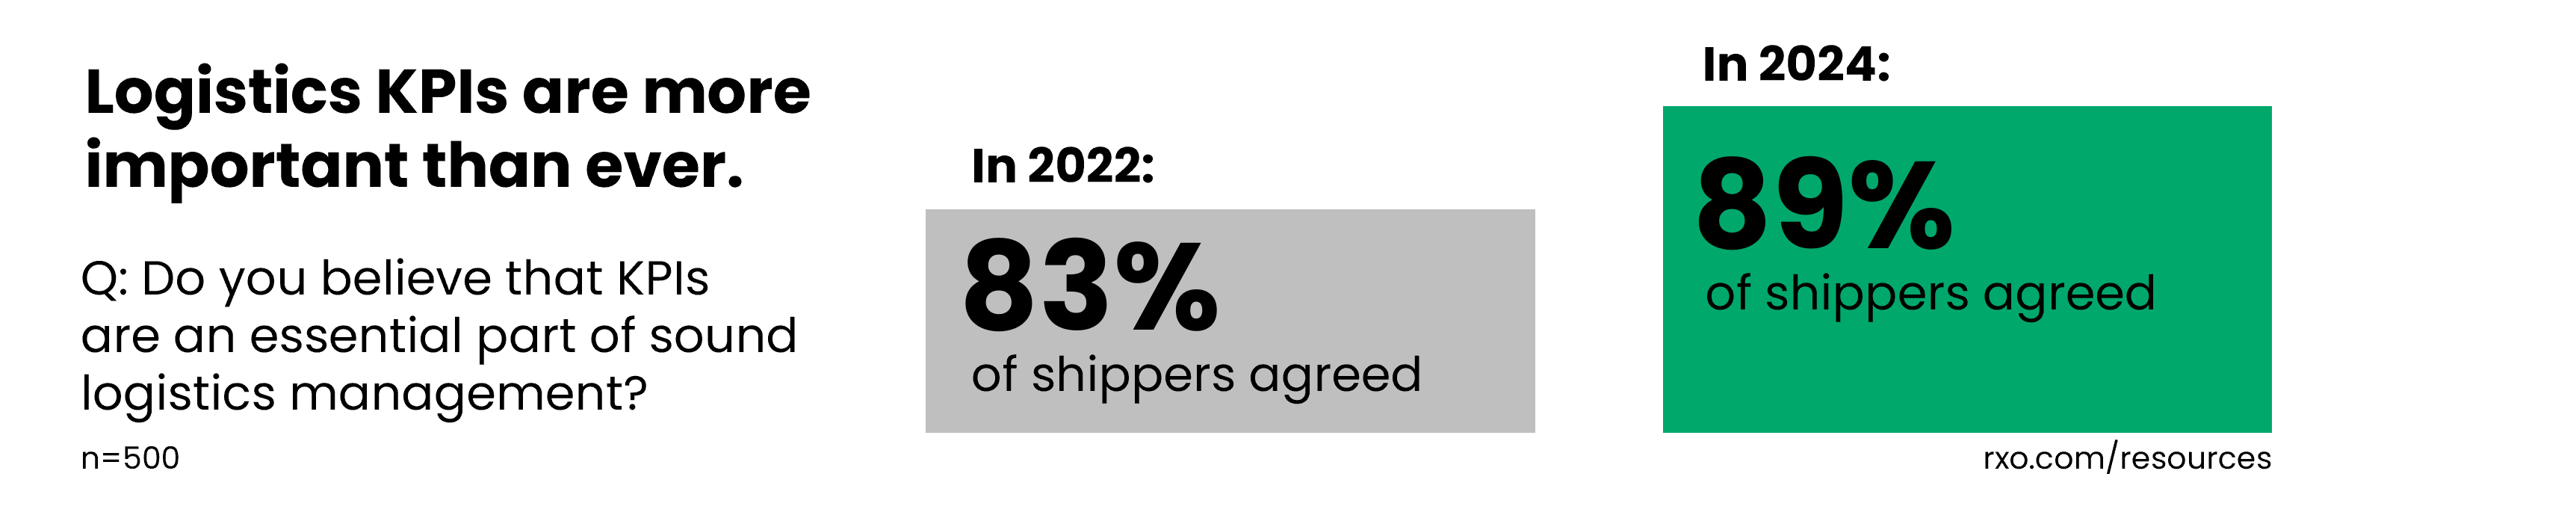
In 2022, 83% of shippers agreed KPIs were an essential part of sound logistics management. This time, that figure is 89%.
Furthermore, when we asked respondents to rate seven core logistics KPIs on level of importance, an average of 80% agreed that they were essential — in 2024, that figure jumped to 87%.
Shippers are getting more KPI-savvy.
Gathering data is one thing. Using it is another. End-to-end supply chain visibility sounds great, but unless you’re actively using it in your day-to-day operations, it’s data for data’s sake.
We can see, however, that as logistics KPIs become more important, shippers are getting more out of their metrics.
You can also download these charts as slides and/or the whole study as a PDF.
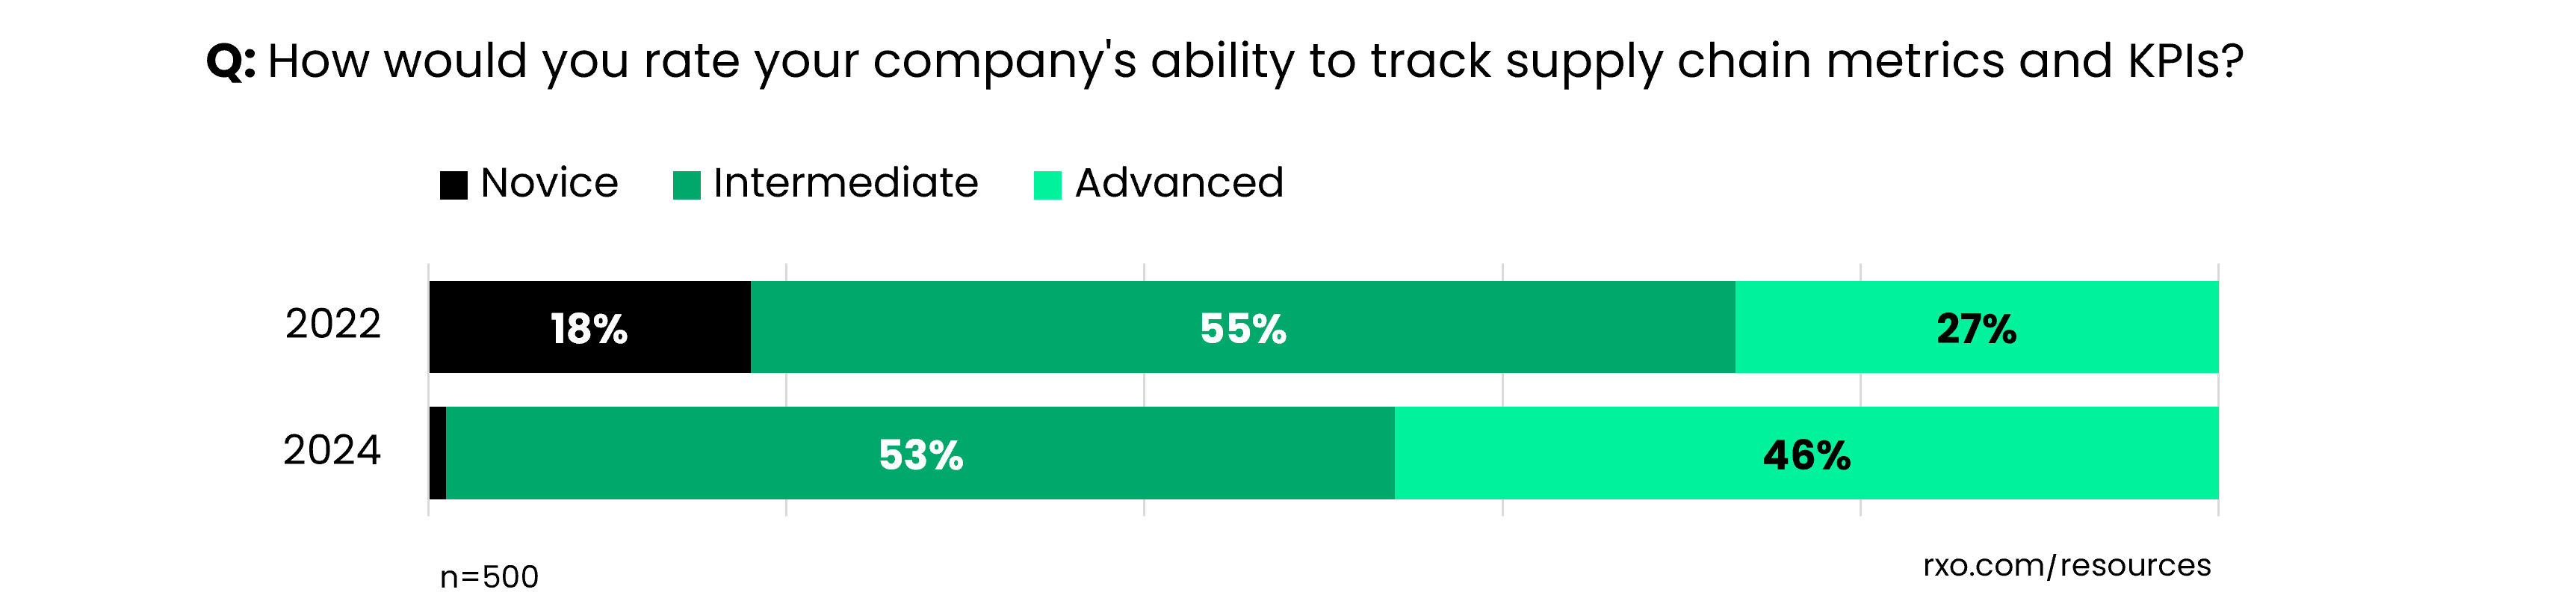
Shippers are getting better at tracking KPIs.
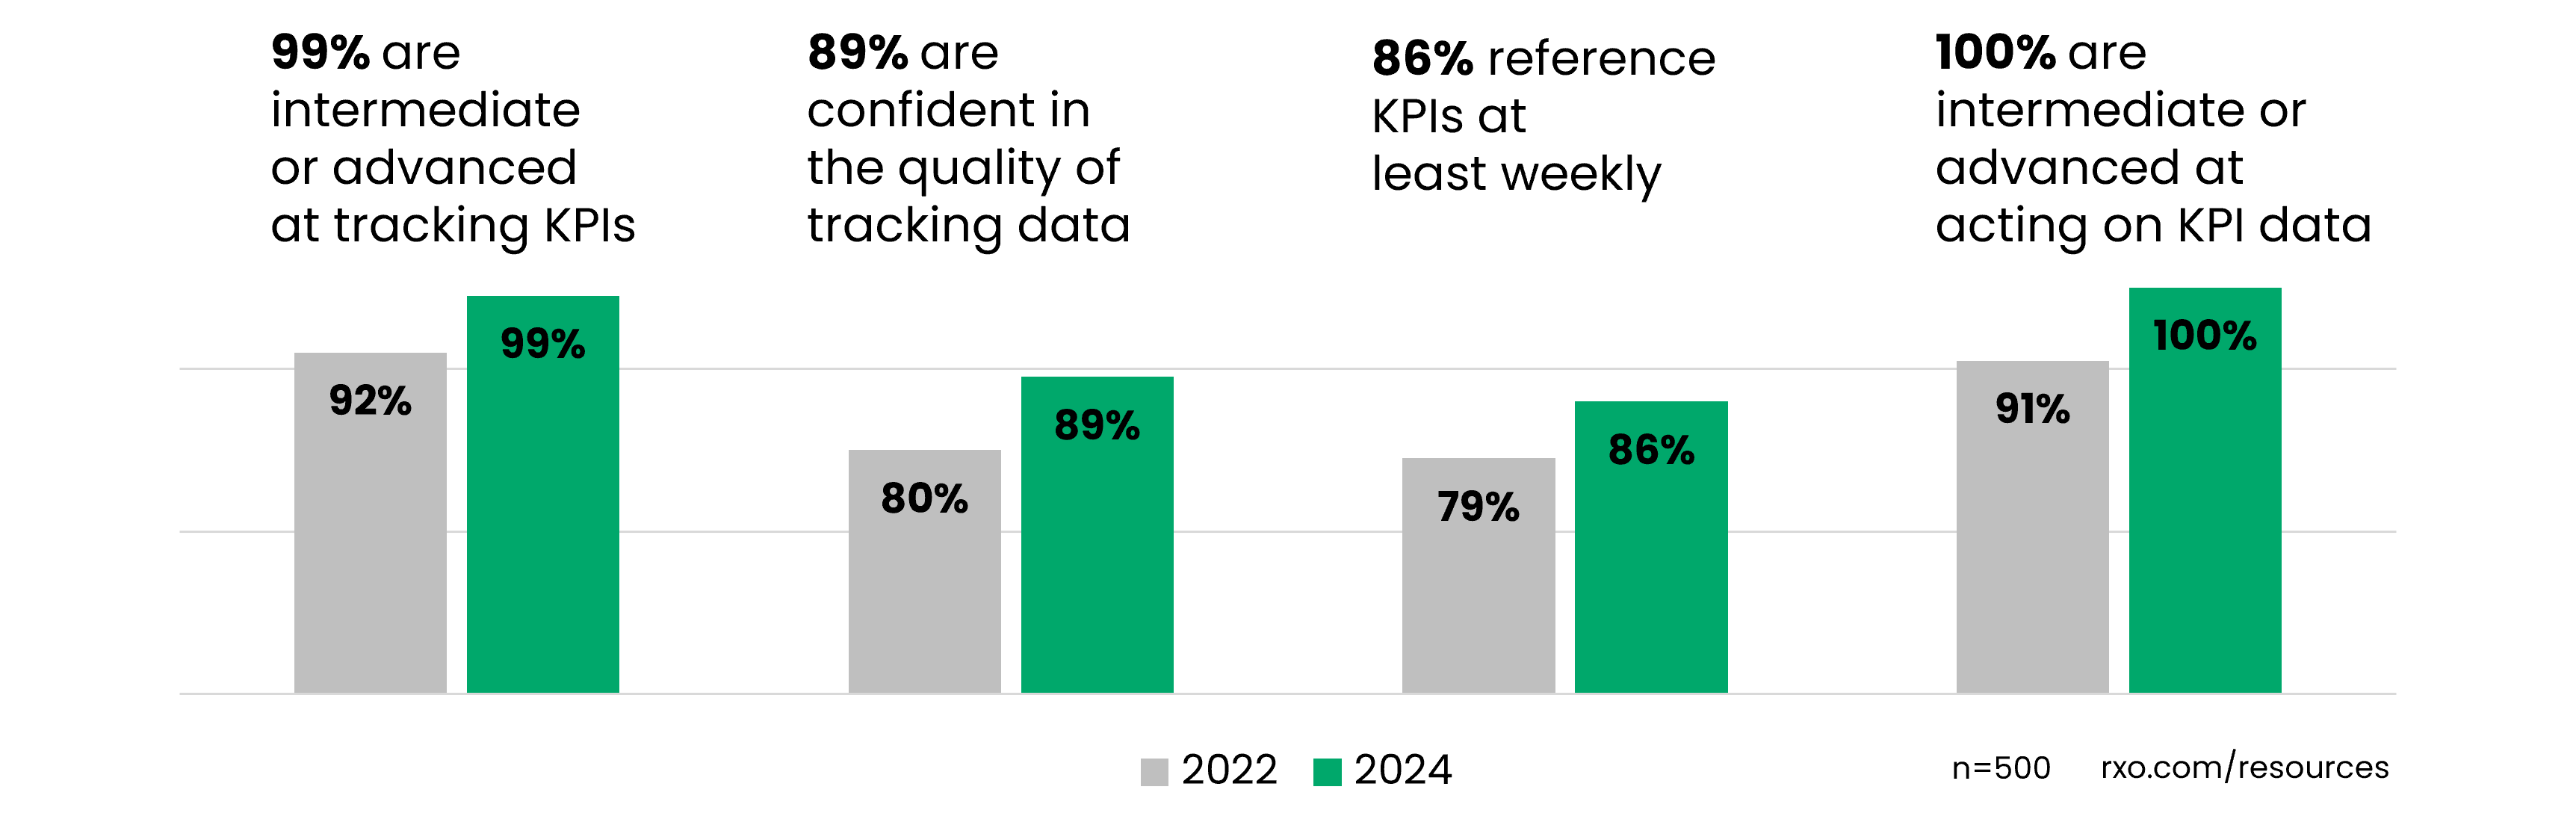
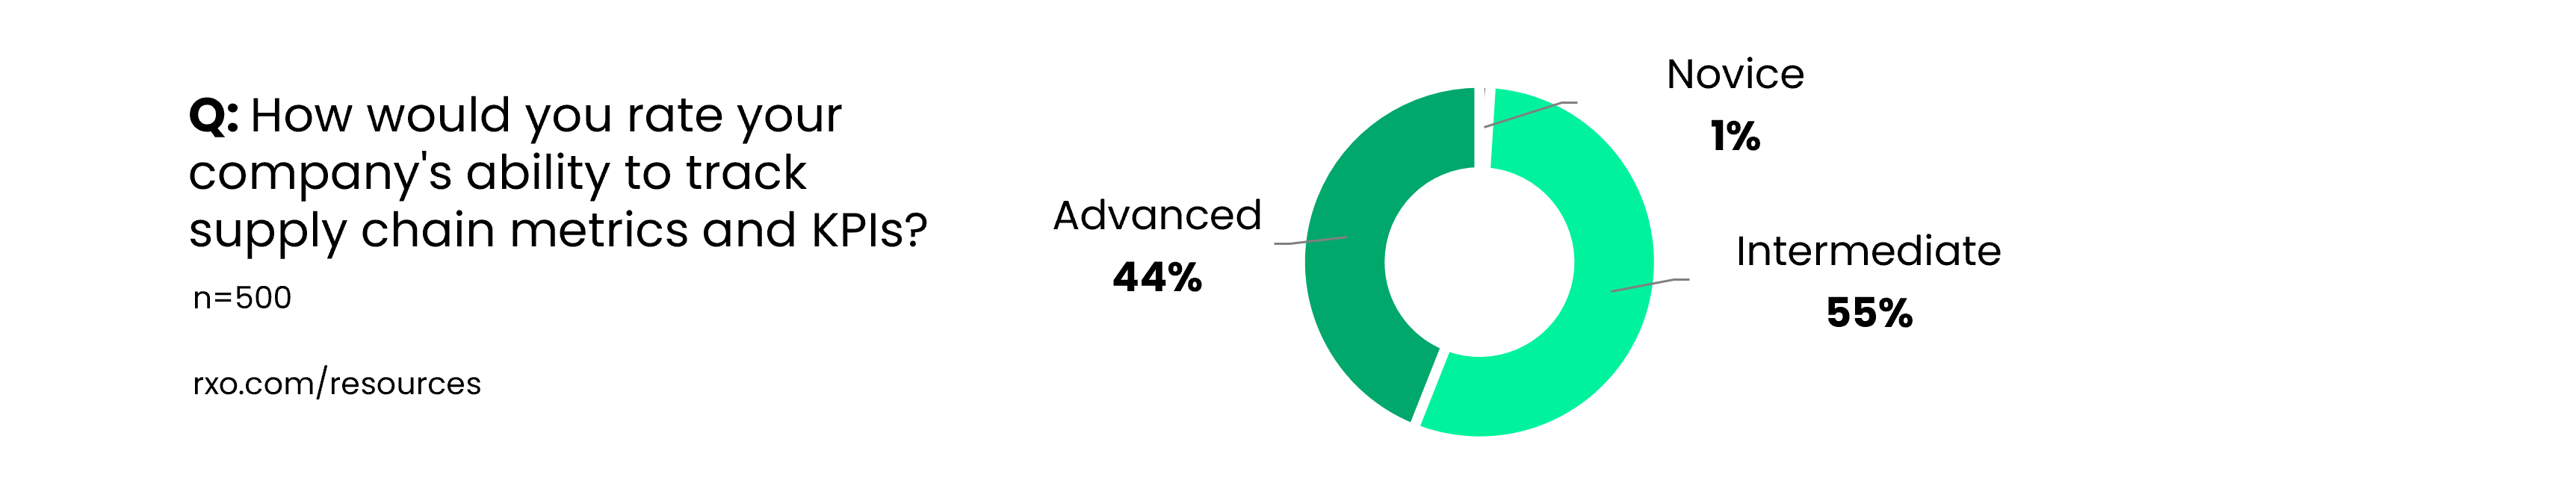
Virtually no one is at the starting line when it comes to tracking transportation metrics — 99% of shippers rate themselves as either intermediate or advanced at tracking logistics KPIs, up from 92% in 2022.
Shippers are getting higher quality data.
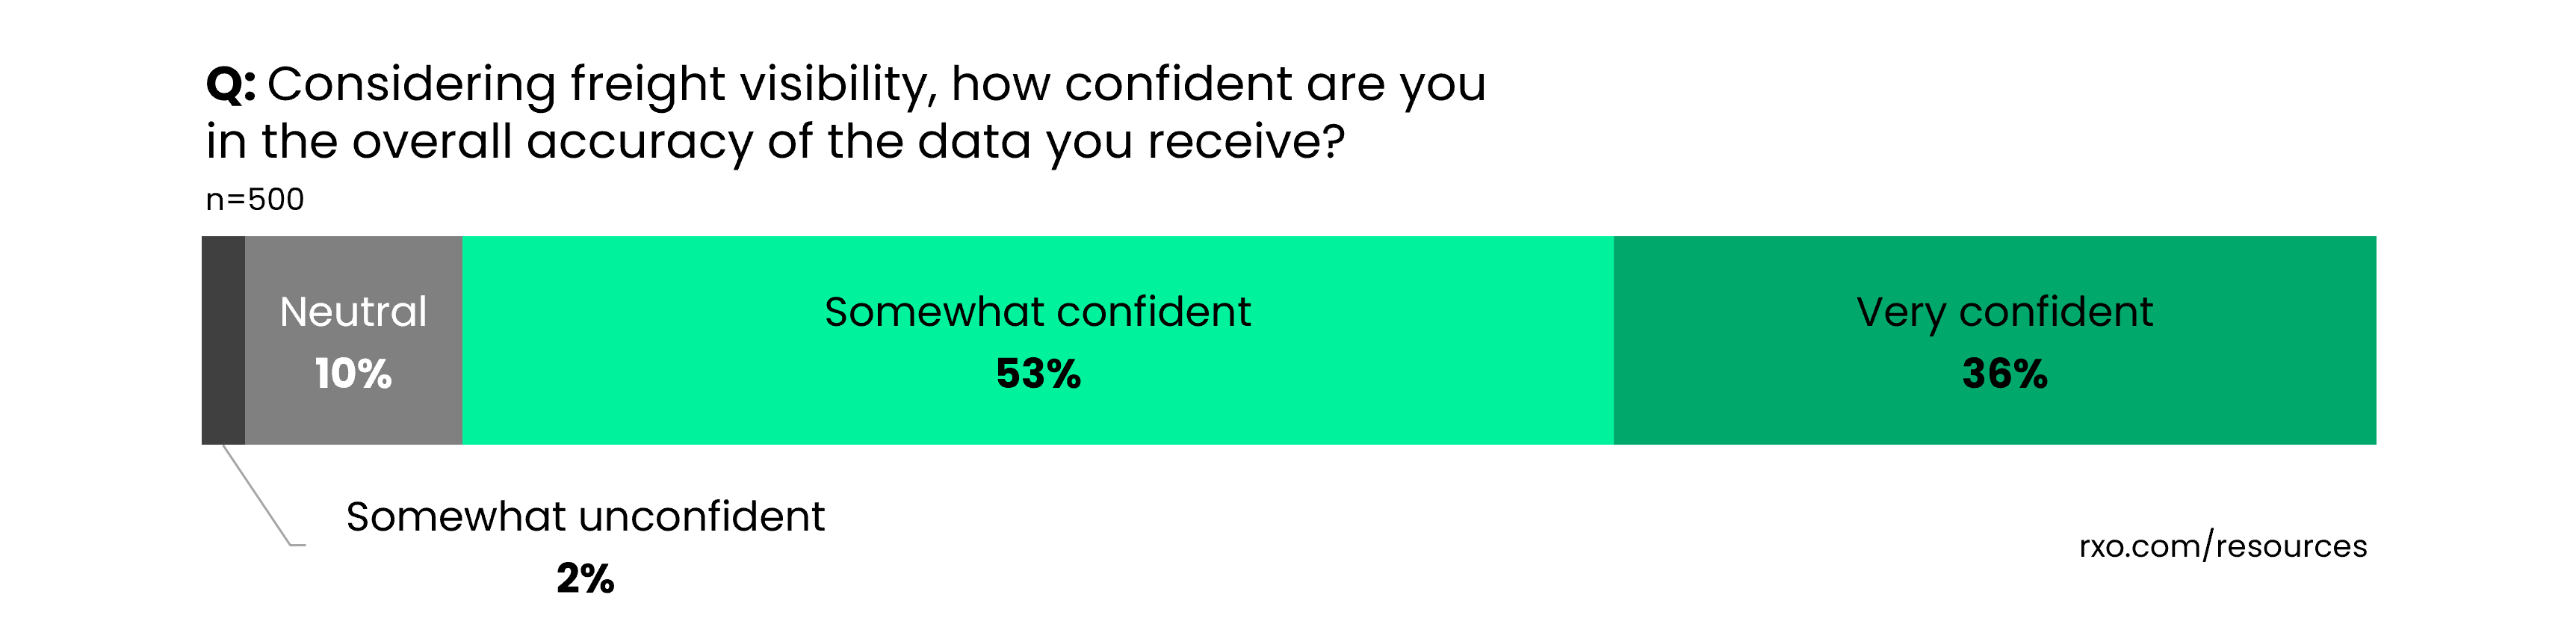
Overall, 89% of shippers are confident in the accuracy of the shipment tracking data they receive, compared to 80% in 2022.
Furthermore, in 2022, 50% of shippers said getting accurate data was a top KPI challenge (the number one challenge overall). This time, only 33% of shippers think it’s a top challenge.
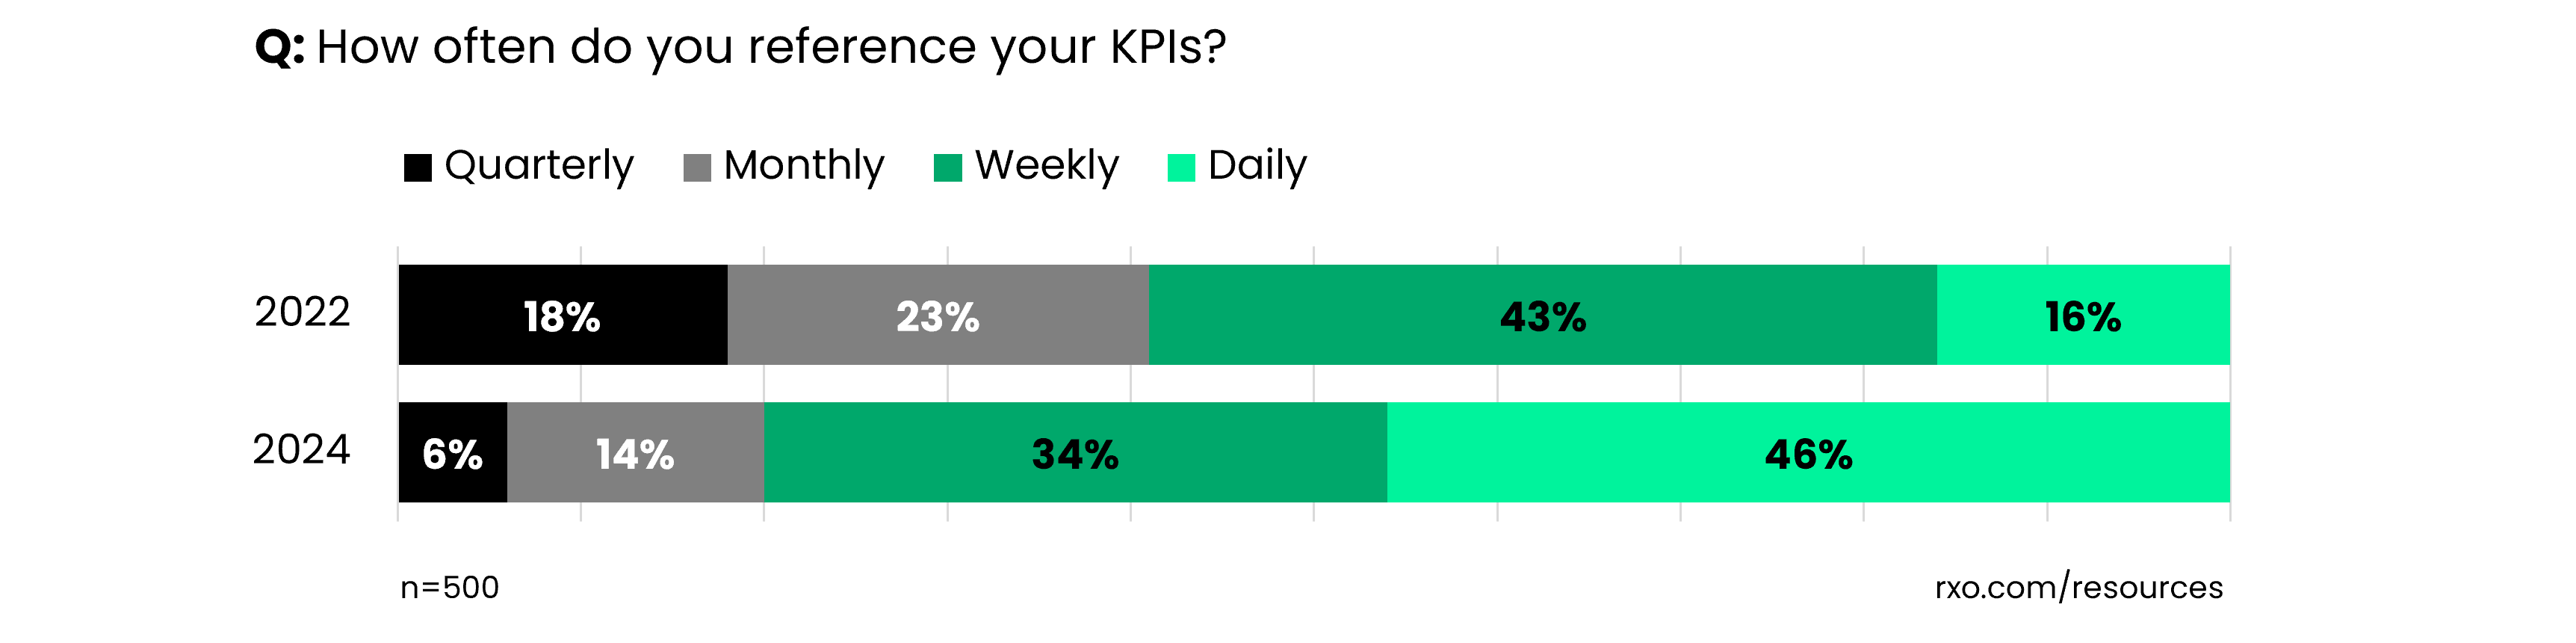
Shippers are referencing KPIs more often.
86% of shippers reference their logistics KPIs weekly, with 45% referencing daily, up from 79% and 32% in 2022, respectively.

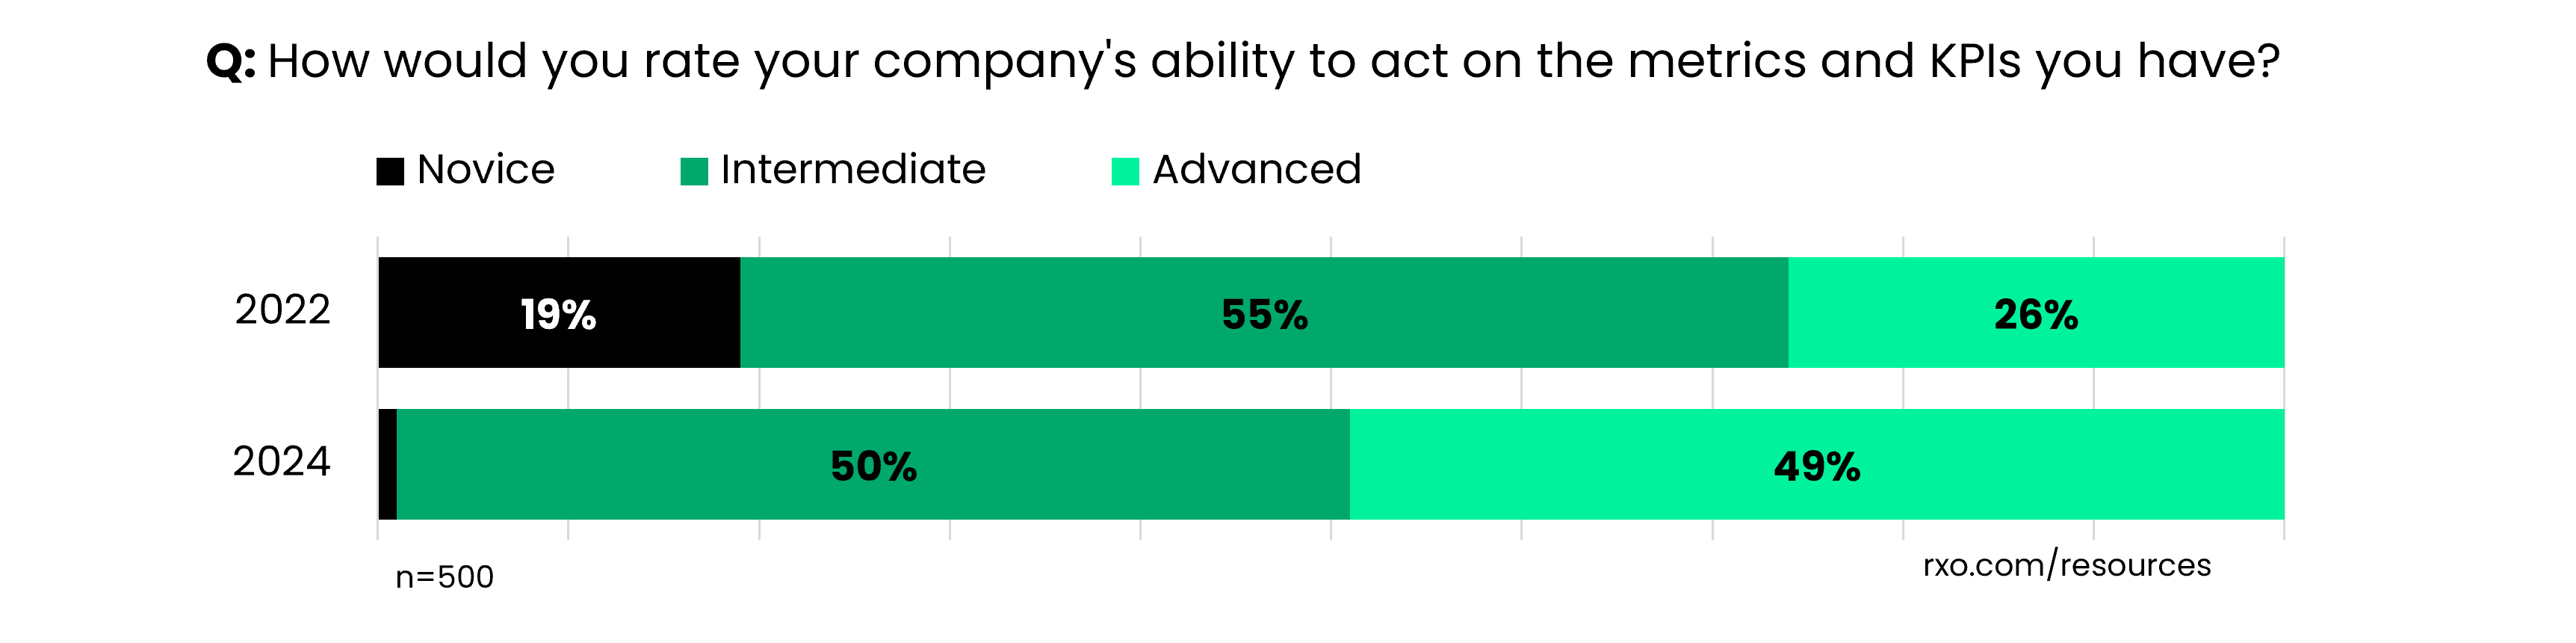
Shippers are getting better at using that data, too.
100% of shippers think they are either intermediate or advanced at taking action on the logistics KPIs they have, up from 91% in 2022. Furthermore, 42% think they’re advanced, compared to 36% in 2022.

Logistics Technology & KPIs
We’ve clearly seen that shippers are getting more KPI-savvy — we can attribute at least some of that improvement to an increase in technology capabilities and usage.
In 2022, when asked if they thought technology would make KPI tracking and management easier over the next two years, 84% agreed that it would.
That proved to be correct. Two years later, when asked if technology had indeed made logistics KPI management easier, 91% agreed that it had, turning an additional 7% from skeptics into believers.

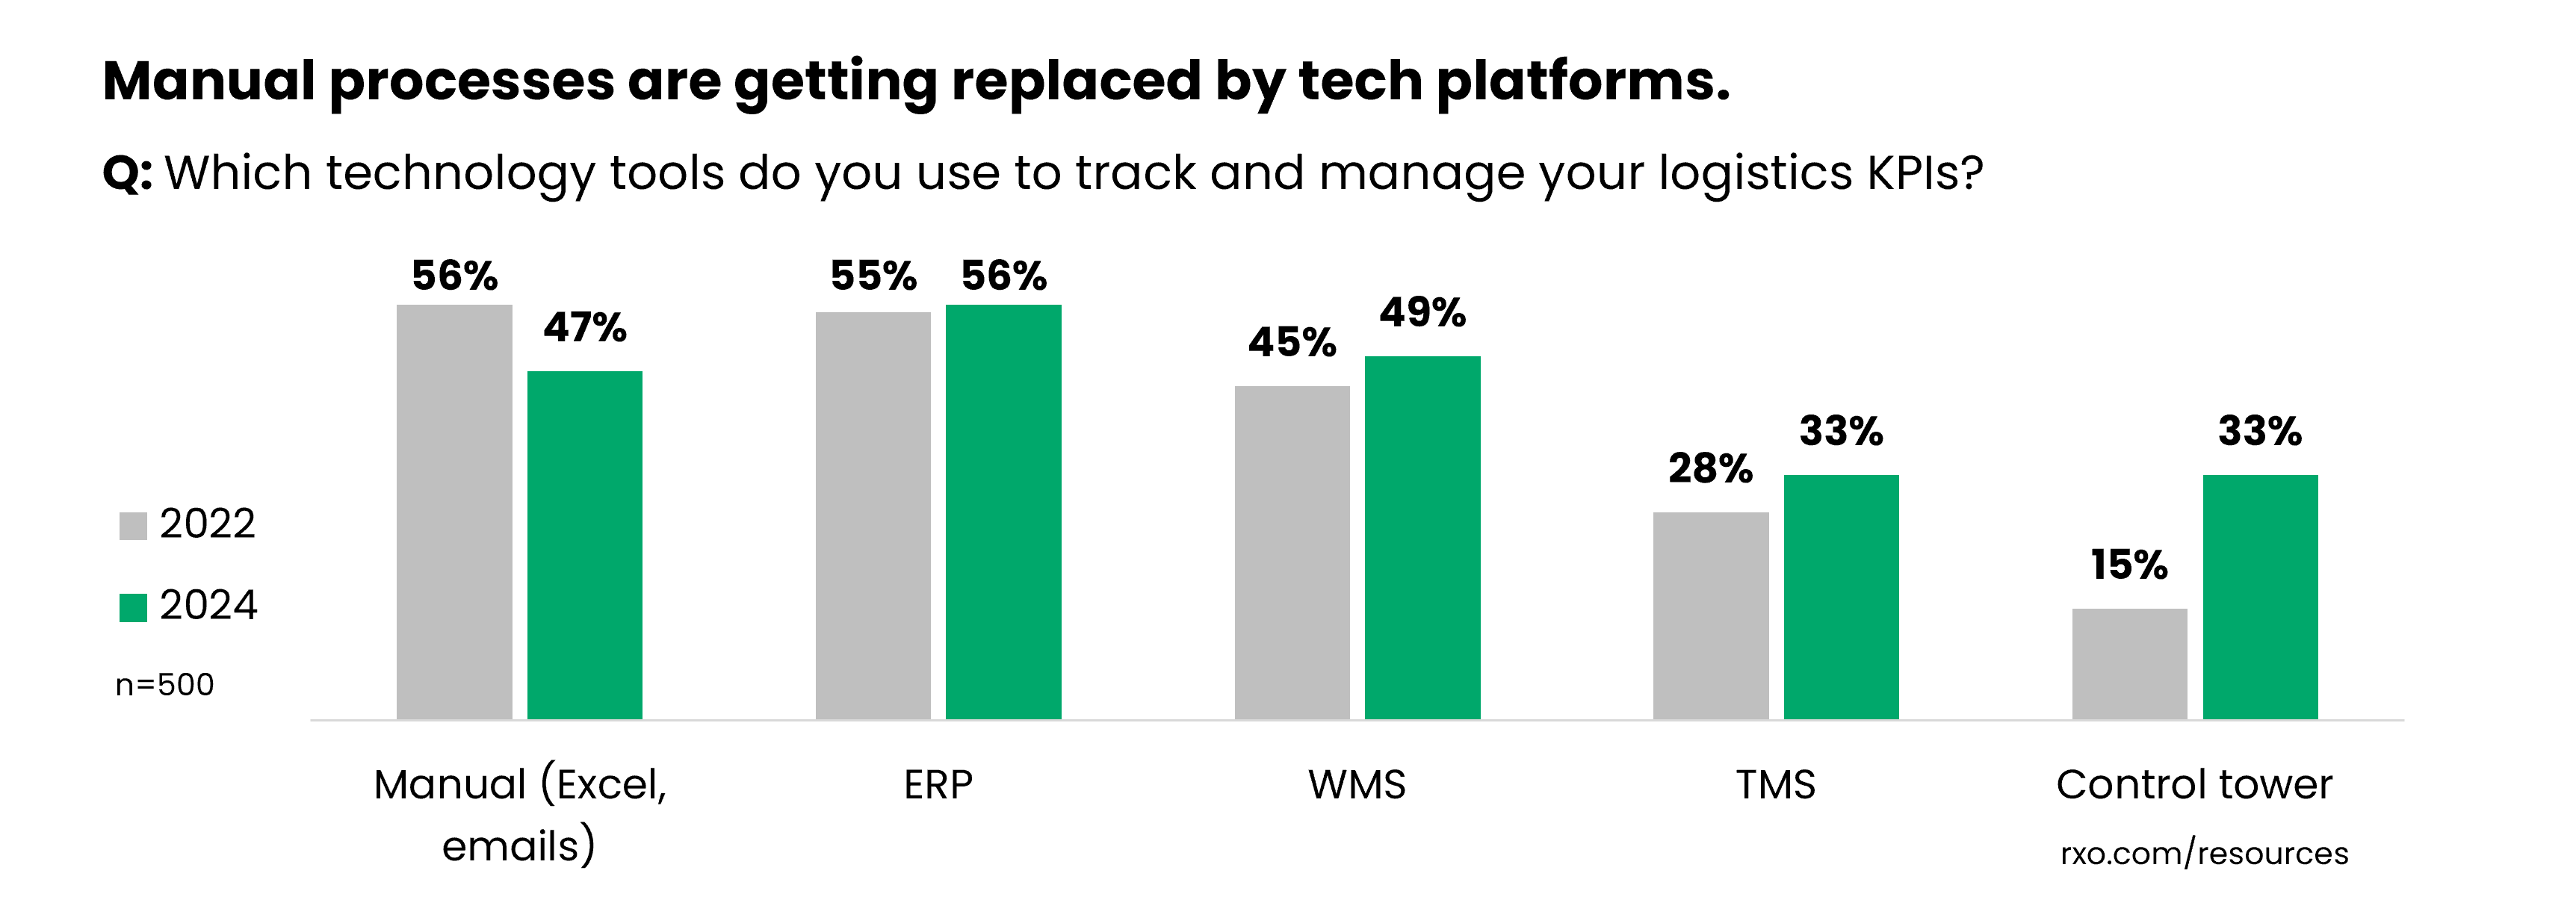
What logistics technology platforms are shippers using?
In 2022, 56% of shippers were using manual processes (email, Excel, etc.) to manage at least some part of their KPIs, making it the most frequently used method for logistics KPI management.
In 2024, that figure dropped to 47%, and fell to third place behind enterprise resource planning systems (ERP) and warehouse management systems (WMS).
Shippers are also getting better at integrating insights from multiple platforms, and we saw an increase in control tower usage from 15% in 2022 up to 33% today.
You can also download these charts as slides and/or the whole study as a PDF.
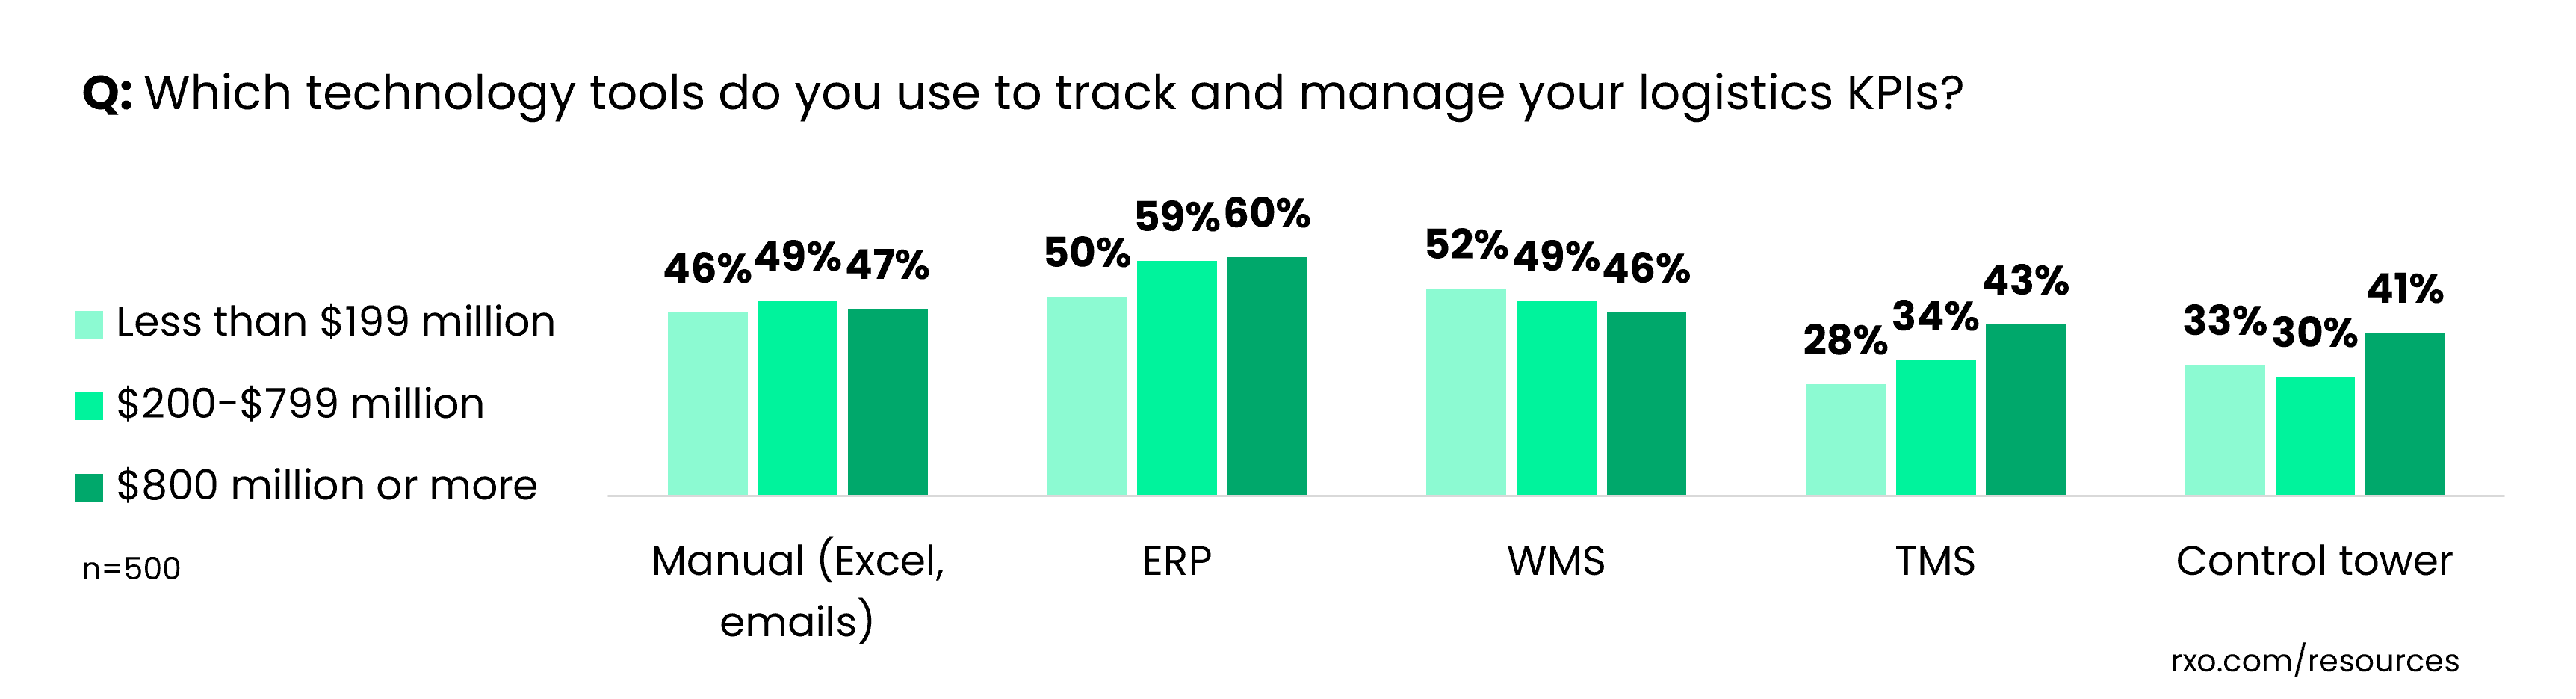
Breaking down technology platform usage by business size, we can see that smaller shippers rely most heavily on their WMS for logistics KPI management, and are least likely to use a transportation management system (TMS).
As shippers get larger, reliance on WMS for KPI management declines, while ERP and TMS usage grows.
Larger shippers also use the highest number of platforms to manage their more complex supply chains; smaller shippers averaged 2.1 systems for KPI management per respondent, compared to mid-sized at 2.2 and large enterprise at 2.4.
With a larger usage of technology comes the need to bring it all together, and large shippers were 28% more likely to rely on control tower technology.
How are companies using AI in freight shipping?
The most talked about trend in logistics (and pretty much every industry right now) is artificial intelligence (AI).
While it’s clear this emerging technology will have a major impact on logistics operations, it hasn’t totally reshaped the landscape just yet.

That said, when asked if they think technology will make KPI tracking and management even easier over the next two years, 90% of respondents agreed that it will.
There is a lot of hype and chatter, but we wanted to learn how it’s impacting shippers right now.

According this this study, 67% of shippers are currently using AI to manage and/or execute their logistics strategy, and an additional 31%, though not currently using, are considering it.
In terms of how they’re applying it, KPI management took the top spot, at 63% of AI users, followed by warehouse management (58%) and carrier procurement (47%).
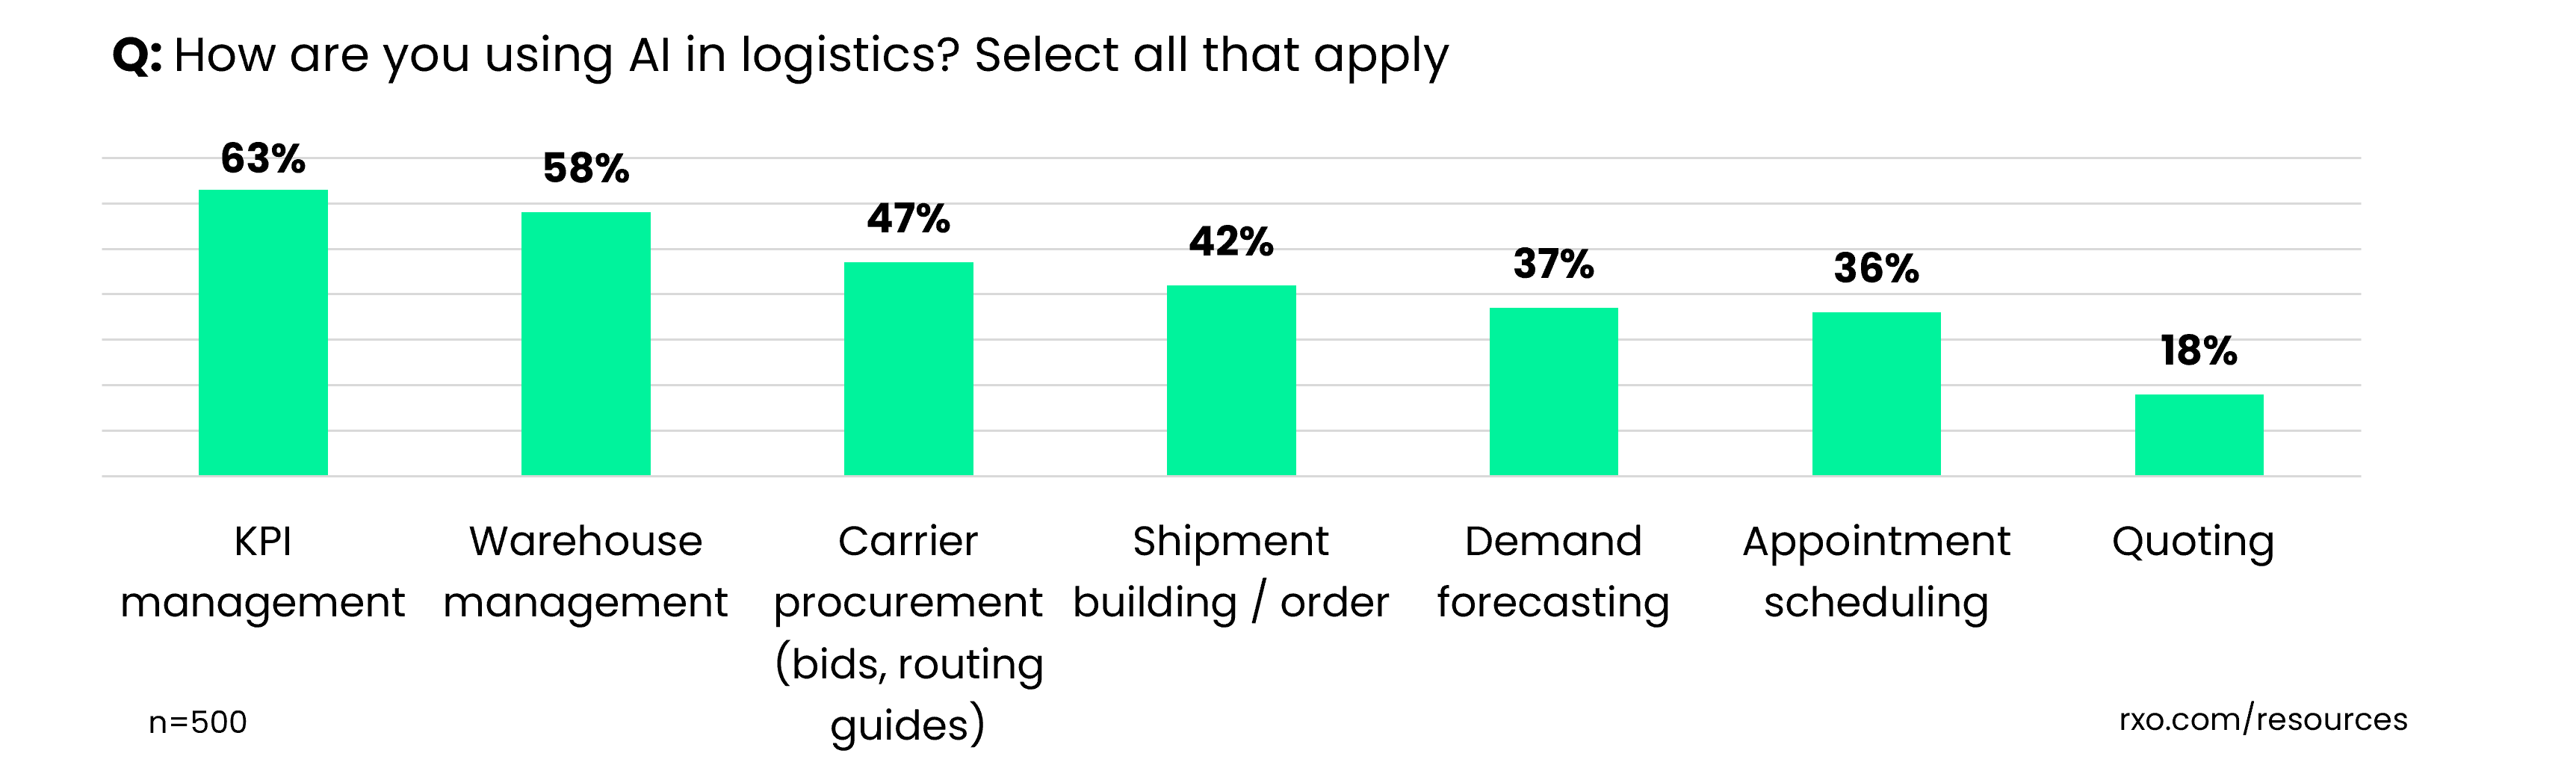
Interestingly, though there are widespread instant quoting capabilities from 3PLs and freight providers, shippers are still hesitant to fully let AI take over their bottom line; freight quoting was the least likely application for AI, at only 18% of AI users.

Relying on Third-Party Providers
Shippers are more KPI savvy, and while technology has played a major role in that improvement, so have third-party providers.
To keep up with competitors, most shippers aren’t trying to do it all themselves, and instead are turning to vendors for help.
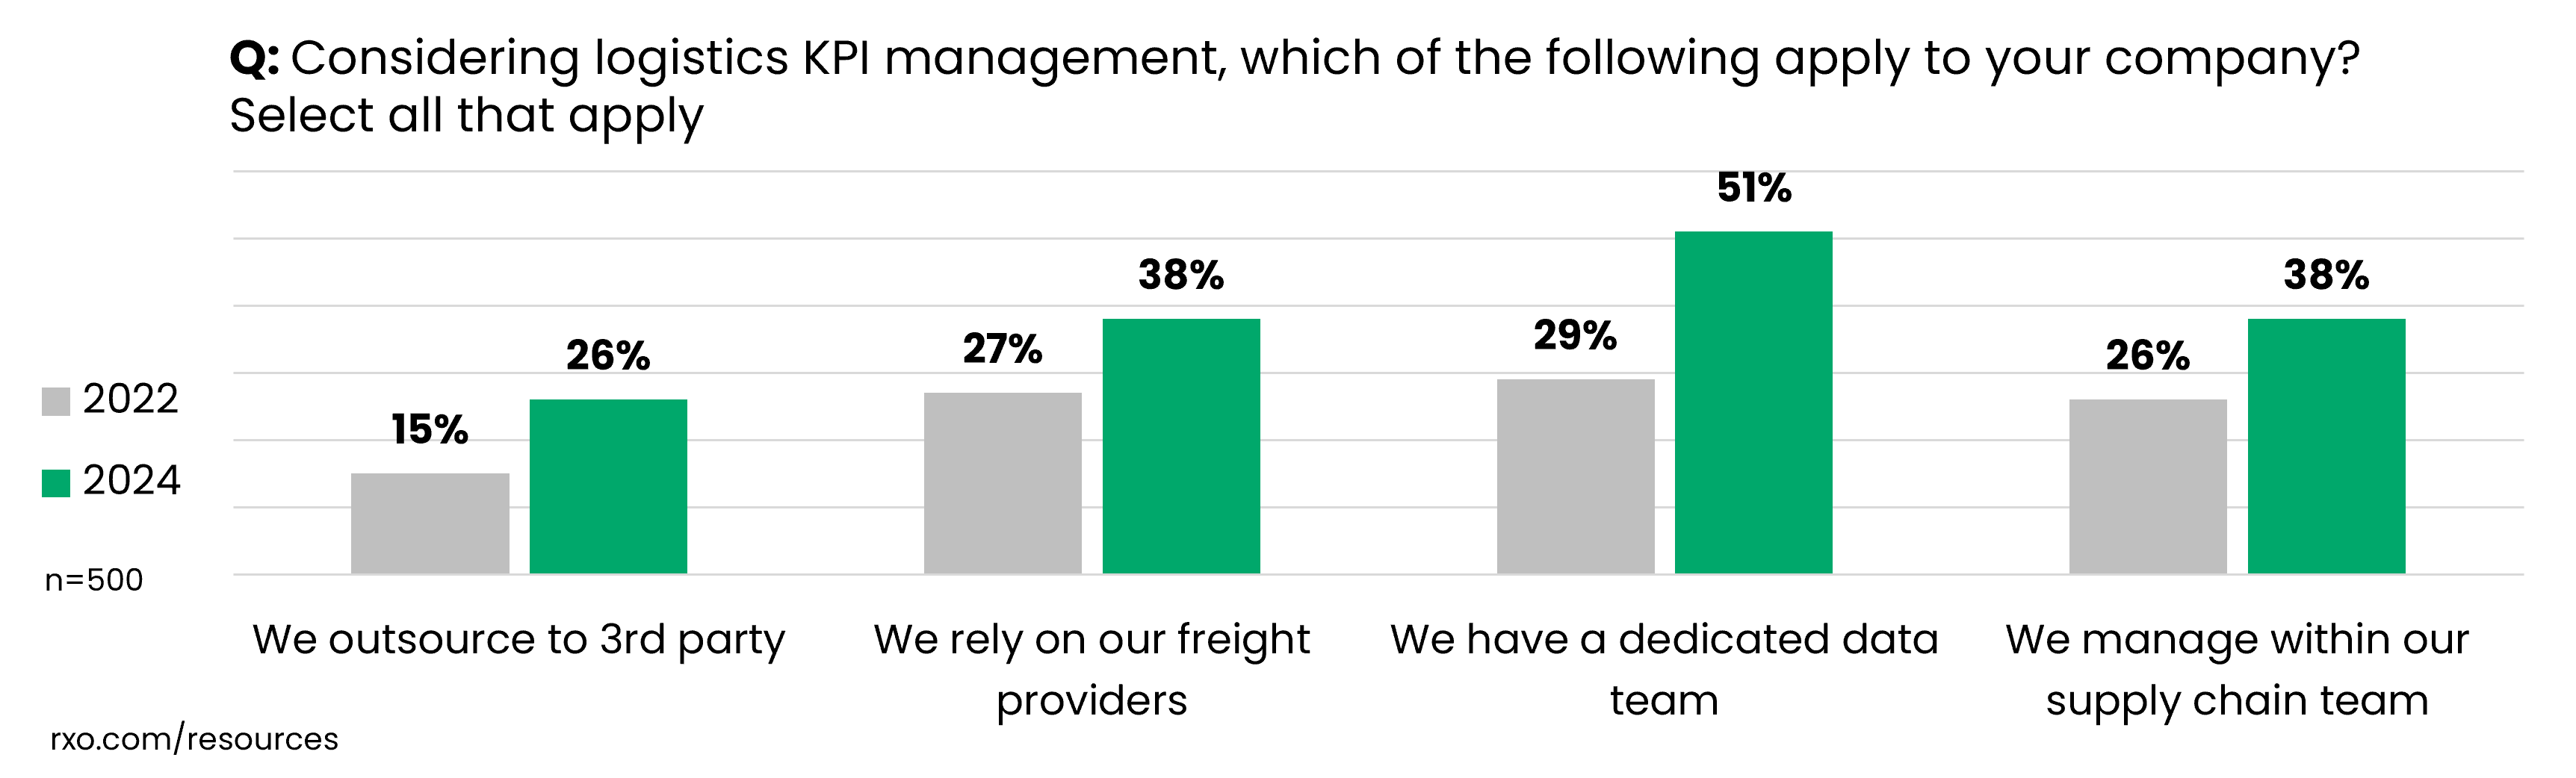
When asked how they’re managing their logistics KPIs, 64% of shippers are looking outside their organization for at least some of their KPI management (26% are using an outsourced provider, and 38% rely on their freight providers).
This is a 22% increase from 2022, where only 42% of shippers used external providers for KPI management.
You can also download these charts as slides and/or the whole study as a PDF.
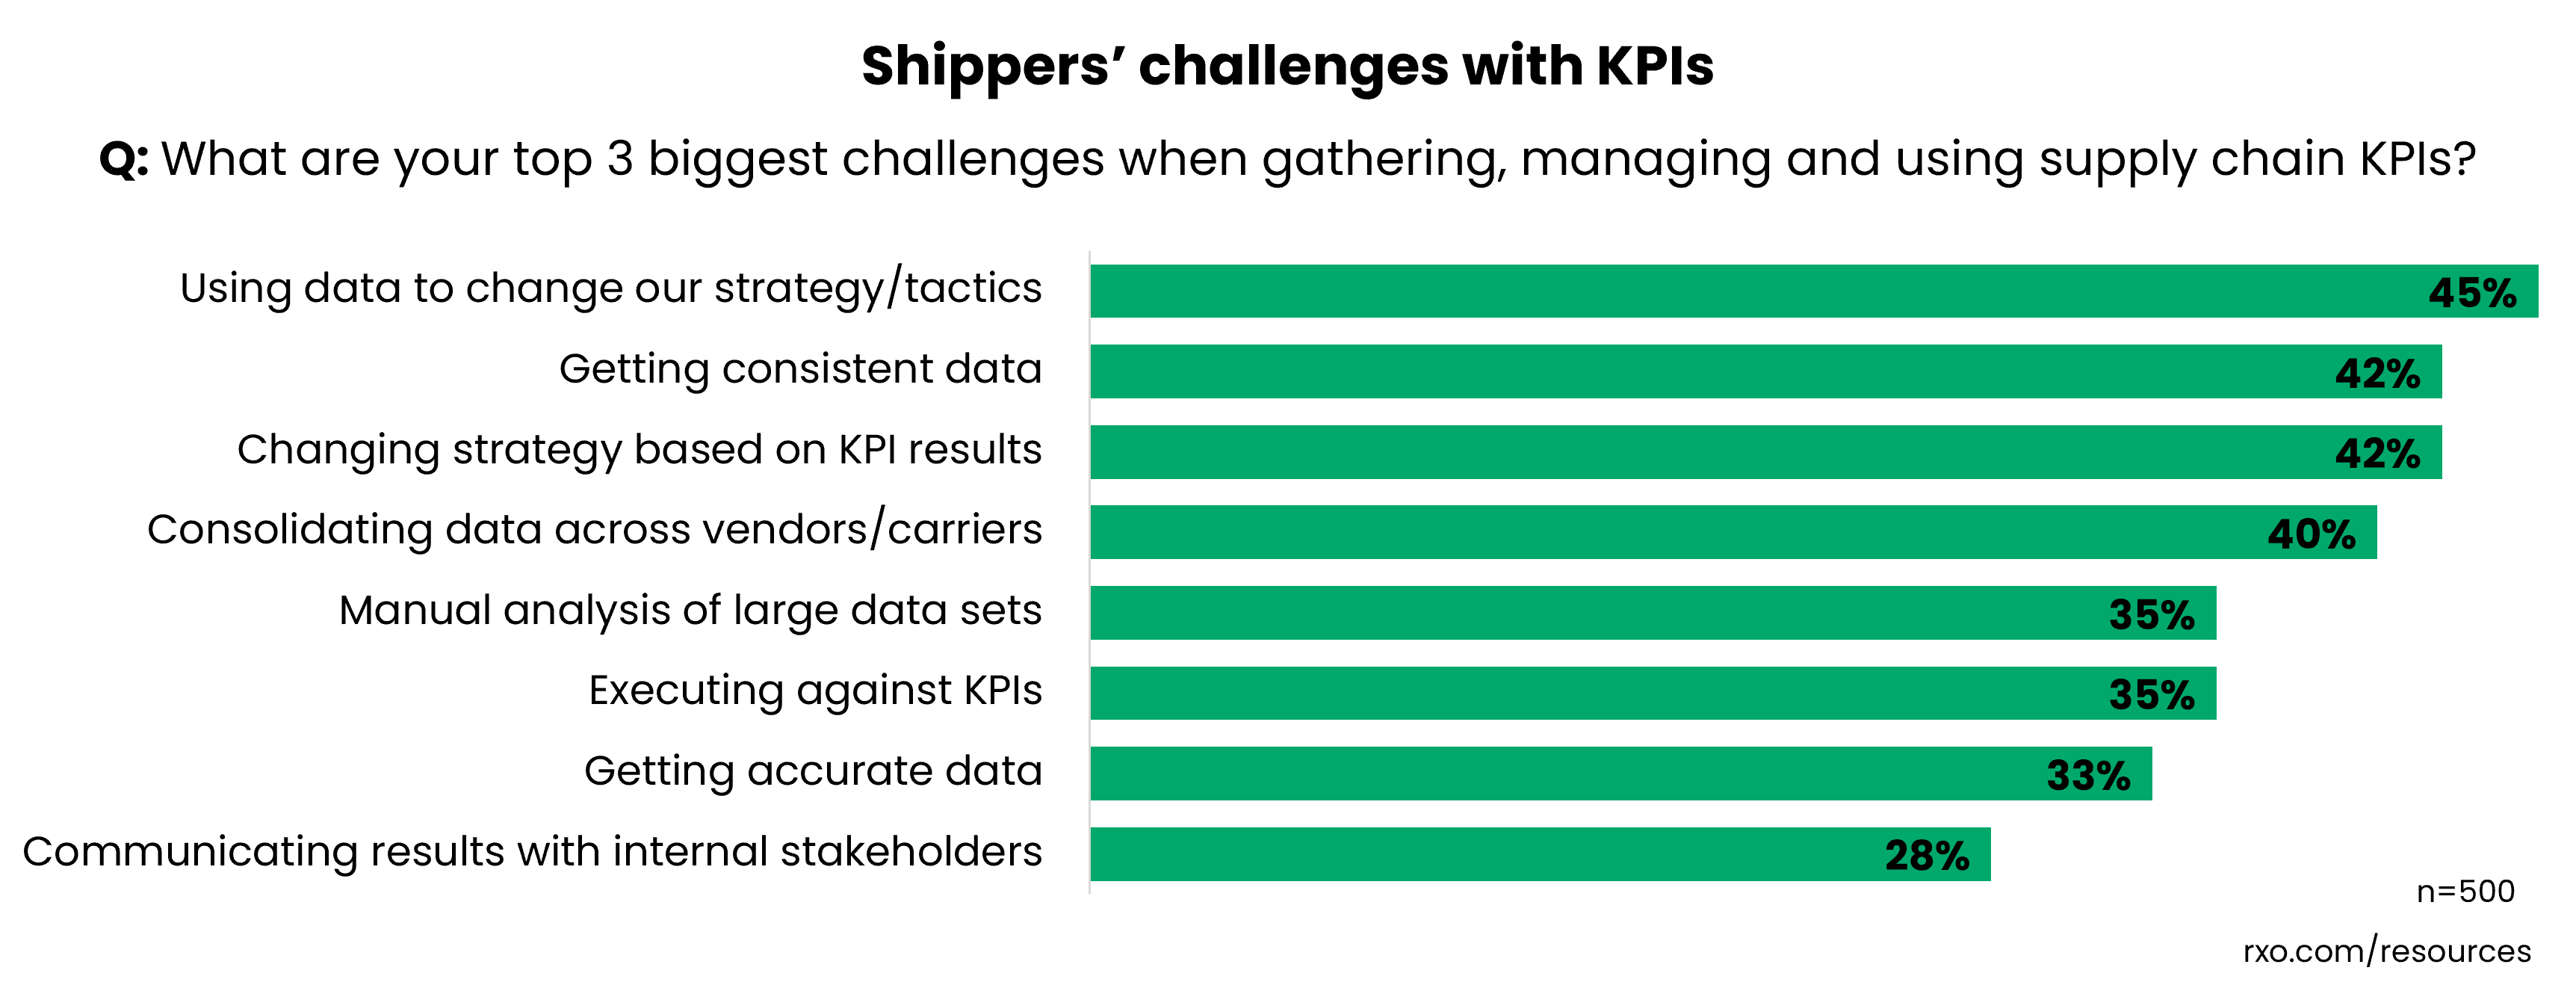
Challenges With Logistics KPIs
While shippers are making progress with their logistics KPIs, it isn’t always easy — shippers still face plenty of challenges with their transportation data.
Though 42% of shippers thought they were advanced at taking action on their KPIs, the top overall challenge was still Using data to uncover insights to change strategy and the third overall challenge was changing strategy based on KPI results.
Furthermore, though 99% of shippers think they’re intermediate or advanced at tracking KPIs, getting consistent data was the second overall challenge.
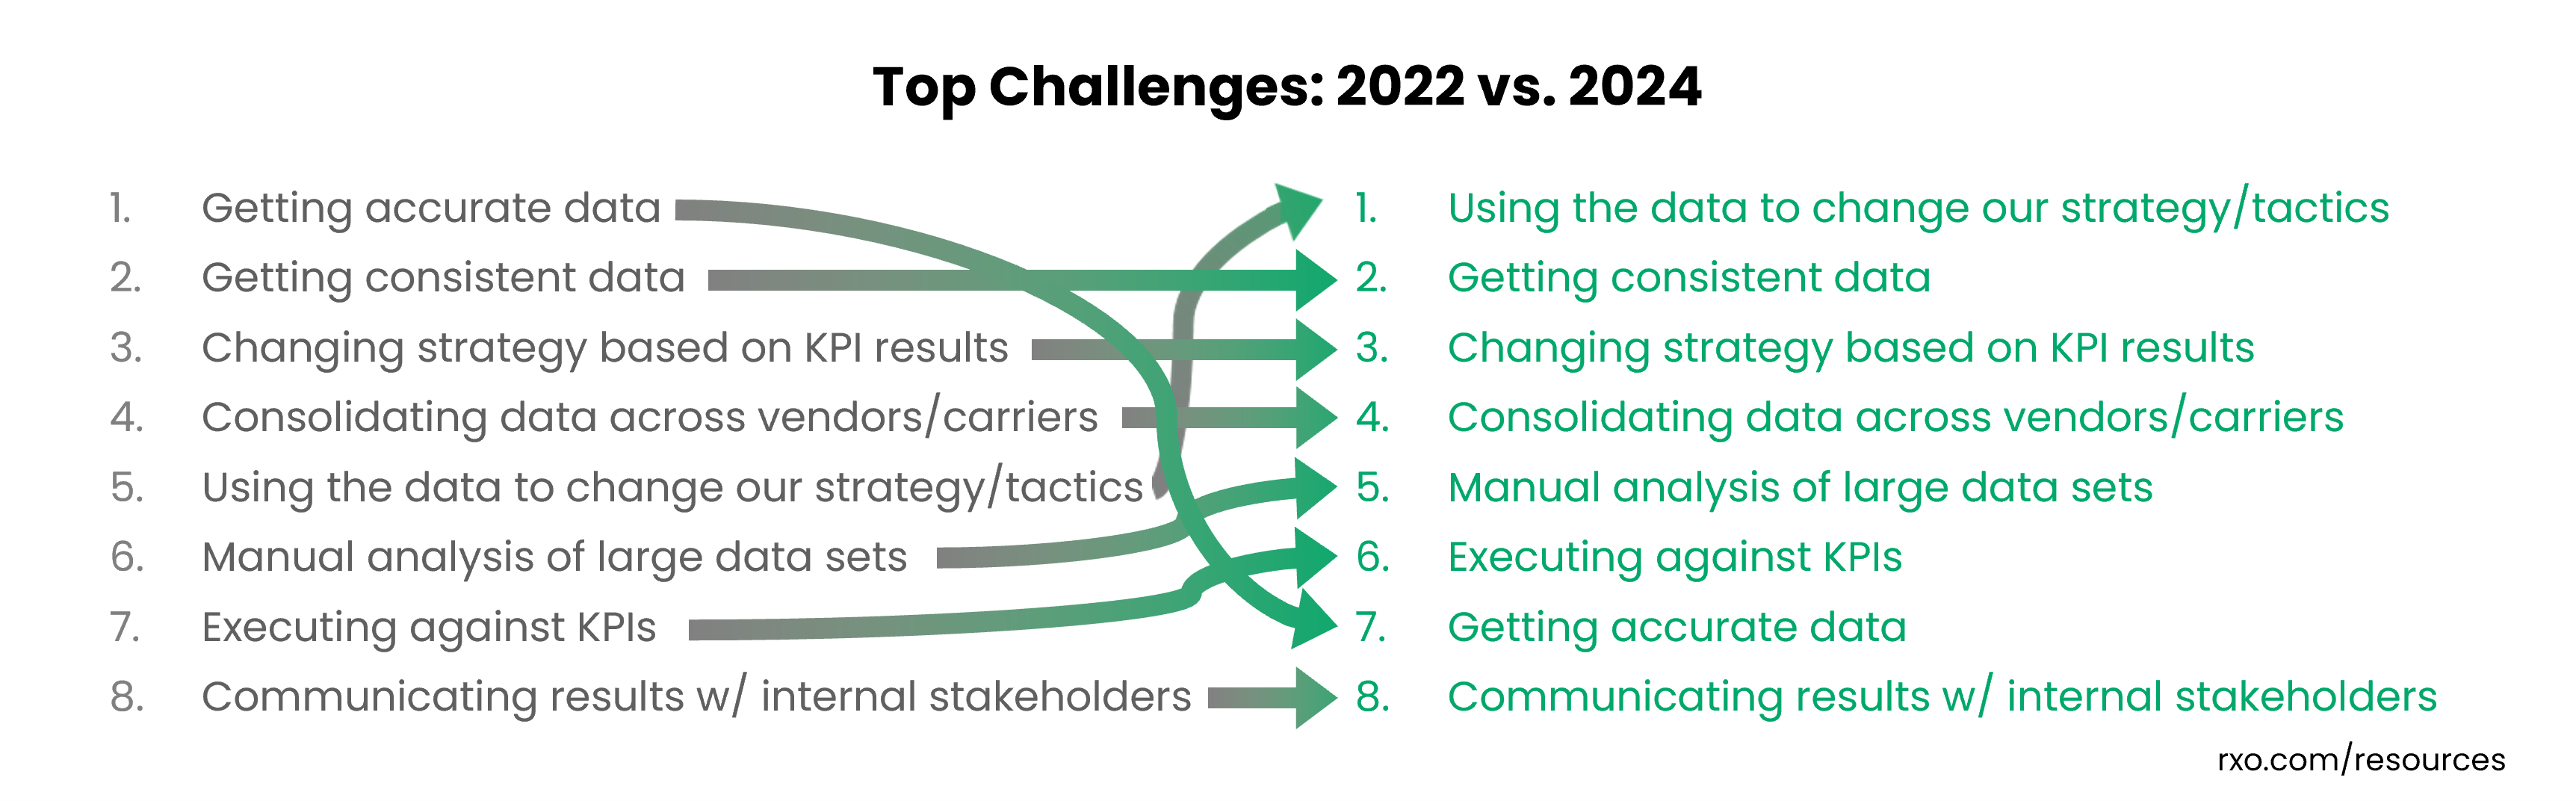
How did logistics KPI challenges change from last time?
Comparing to 2022, the biggest changes were getting accurate data, which fell from number one to seven, and using the data to uncover insights to change strategy, which jumped from five up to number one.
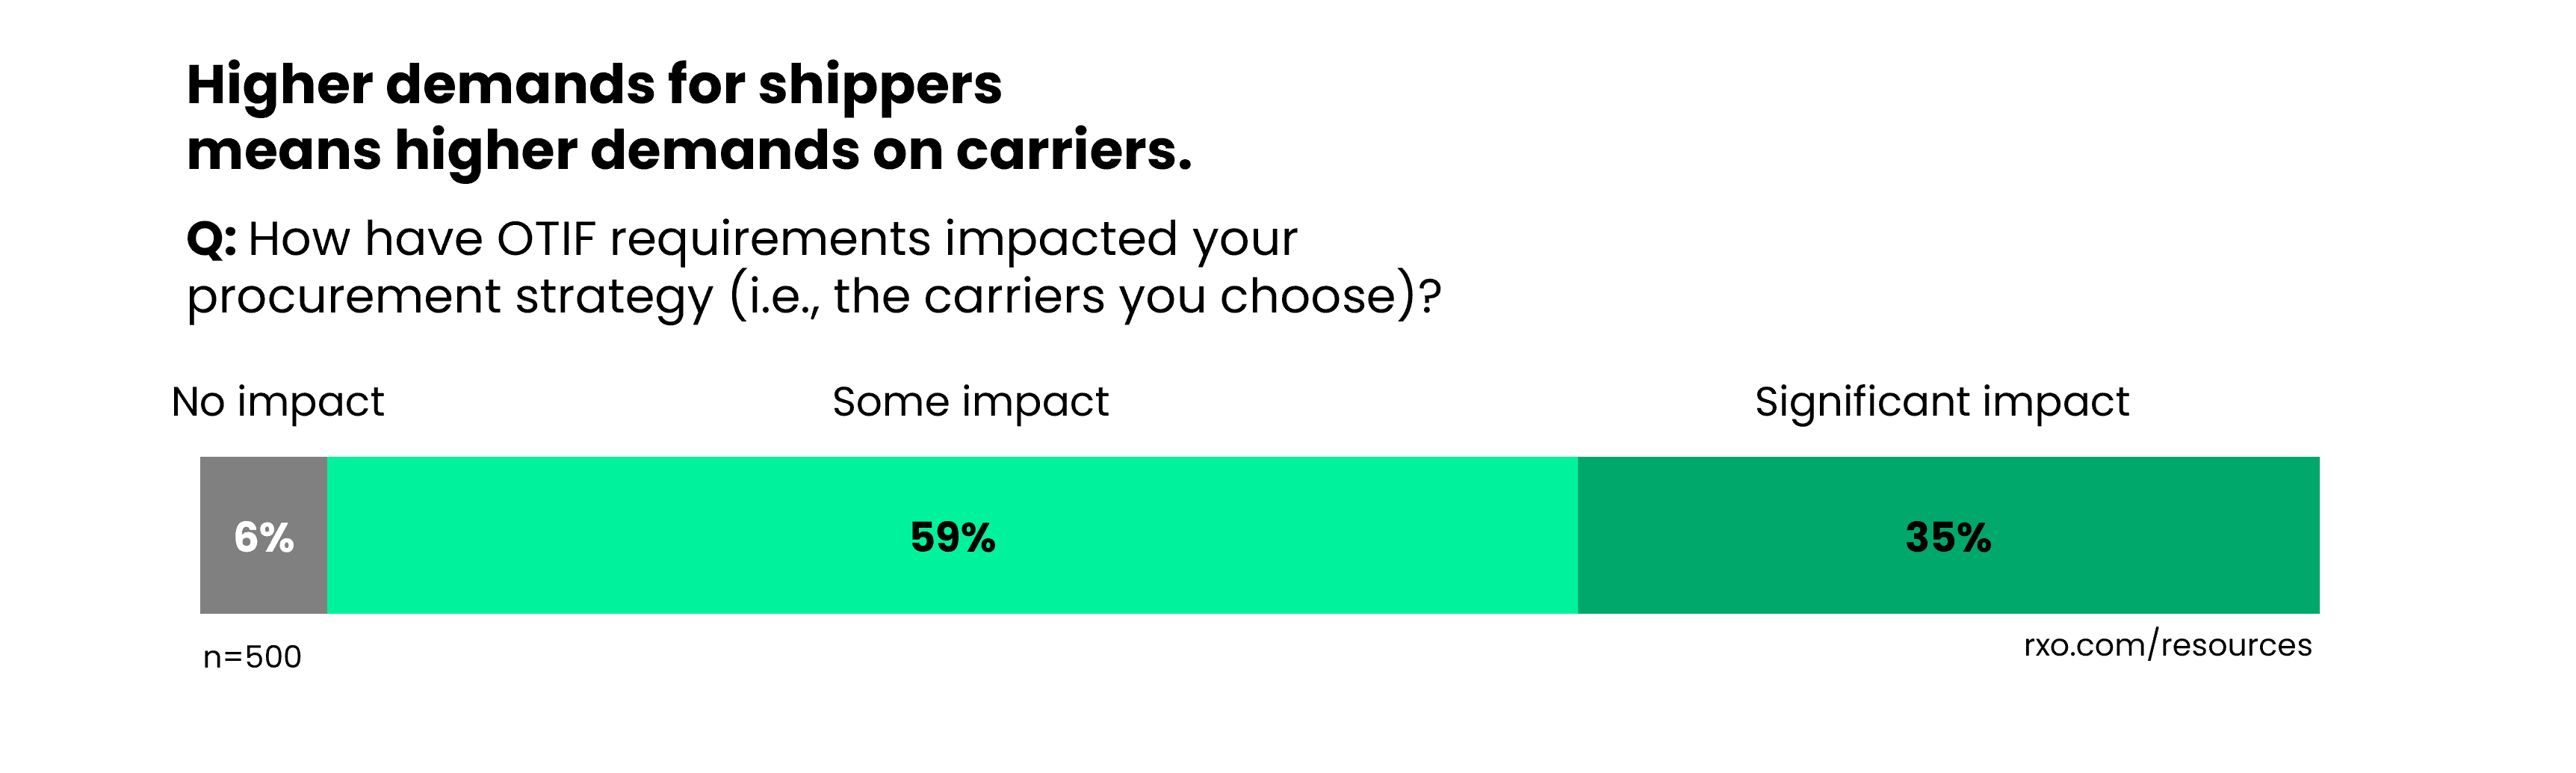
How OTIF Is Impacting Shippers
One of the most common culprits of KPI anxiety? On-time in-full (OTIF). This KPI protocol has placed pressure on many shippers as they try to keep up with rising demands.
In our study, 85% of shipper respondents are contending with OTIF requirements from their customers — how are they coping? By turning to more trusted, more reliable carriers; 94% of respondents said OTIF has impacted their procurement decisions, with 35% saying it has a significant impact.
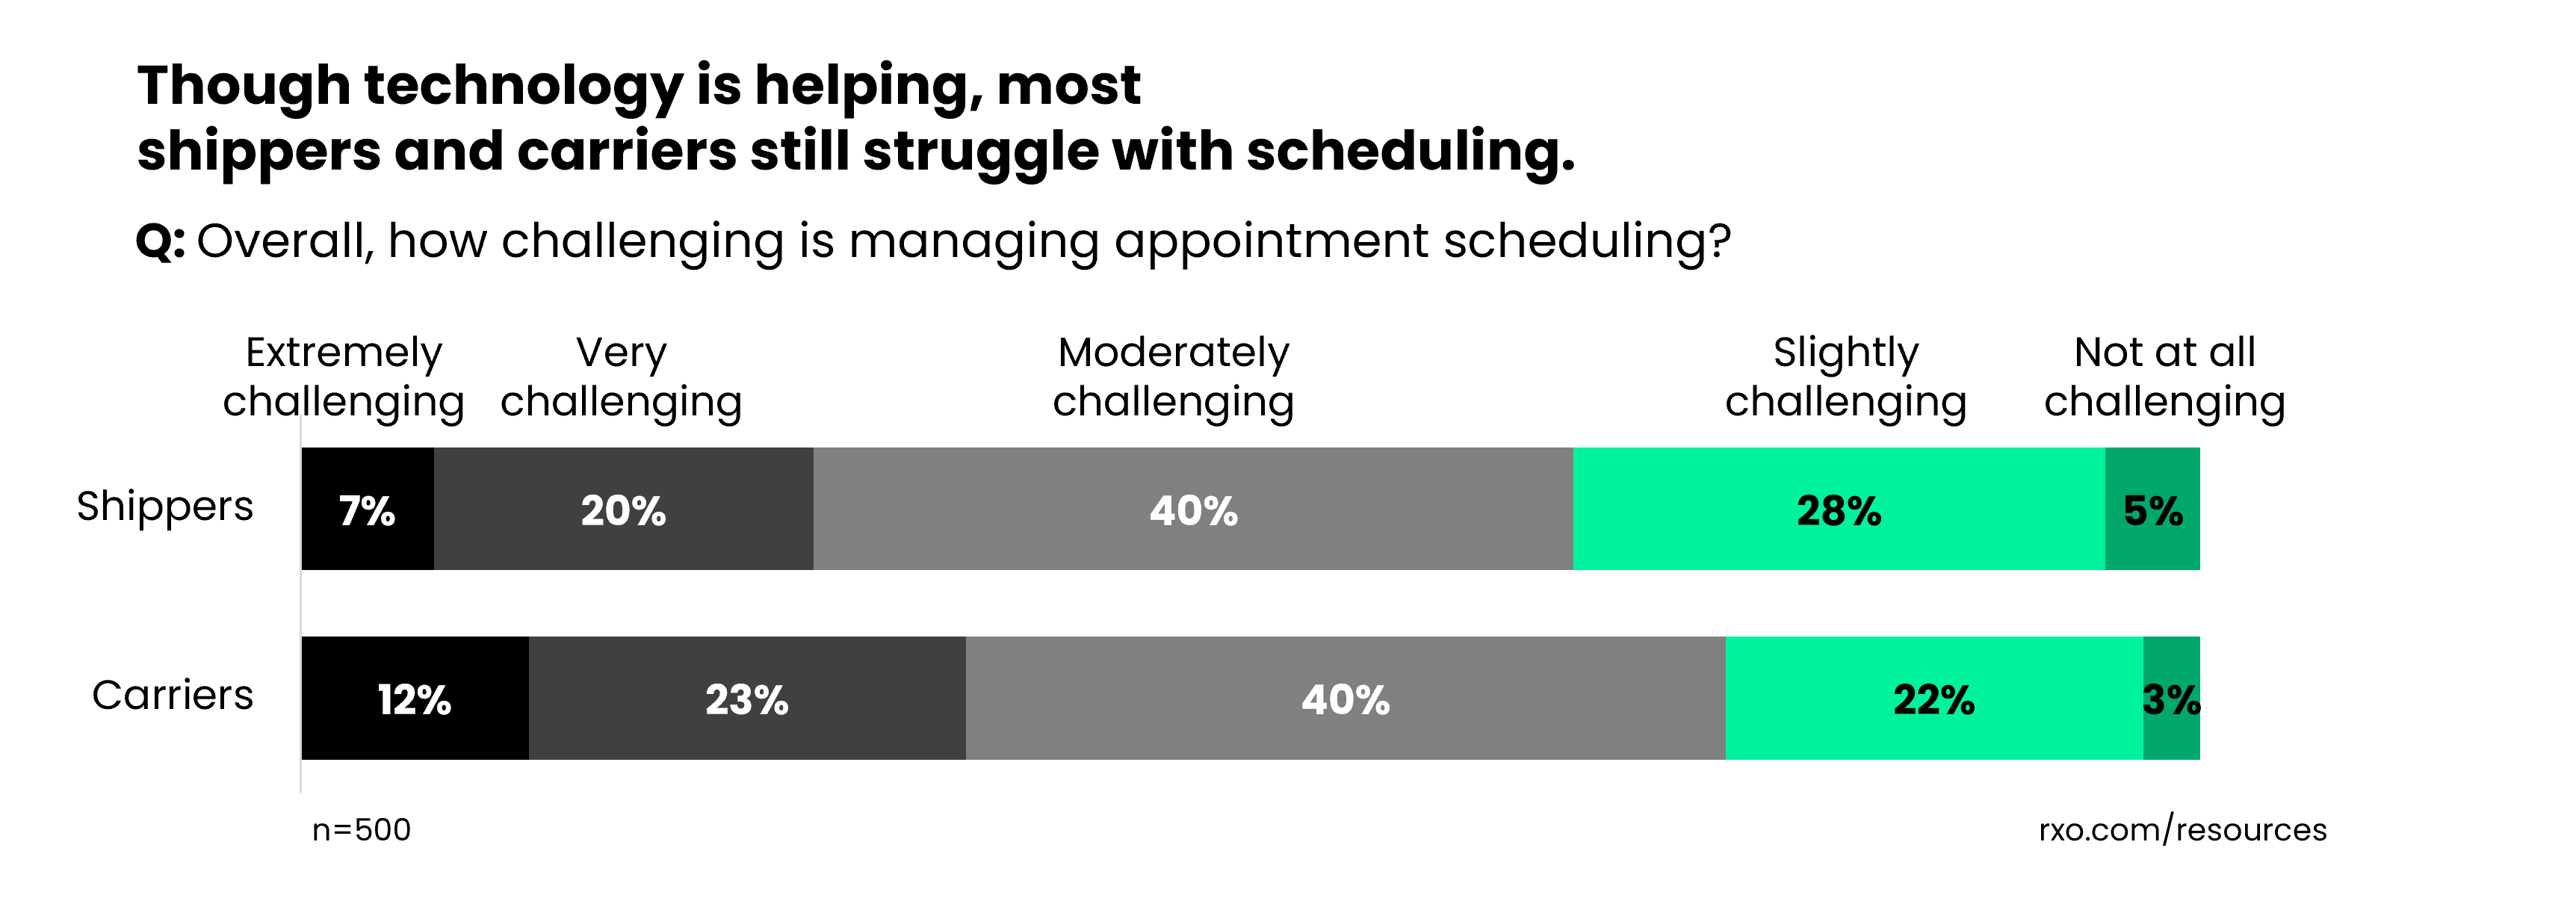
How Shippers Deal With Appointment Scheduling
Another consistent issue closely related to OTIF: appointment scheduling.
While technology is making appointment visibility better (74% of shipper respondents are using third-party platforms to set appointments), it is still a major challenge — 95% of shippers find managing appointment scheduling to be difficult, with two-thirds thinking it’s moderately, very or extremely challenging.
Carriers are struggling with it even more — 97% of carriers find appointment scheduling to be challenging, and nearly twice as many find it extremely challenging.
In spite of it all, shippers are keeping up.
Though they face many challenges, shippers are, for the most part, able to meet their customers’ demands.
In 2022, coming off the tail of peak supply chain disruption, 67% of shippers felt they were able to consistently keep up with their customers’ KPIs, leaving 33% of shippers who felt like they were falling behind.
Now that we’re in a more stable shipping environment, even more shippers feel like they’re able to keep up, with 72% feeling like they’re able to meet their customers’ demands.
Shippers are not taking a one-size-fits-all approach to their customers — 71% tier their customers and change their KPI standards for different accounts.
And for good reason; different customers have different demands. Best-in-class shippers know when to adjust their procurement strategy to keep their customers happy while protecting their budgets.
The Metrics That Matter Most:
Ranking Logistics KPIs by Importance
We’ve covered how businesses are gathering, managing and analyzing their supply chain KPIs. Now it’s time to see what they’re actually collecting and using.
What KPIs are they measuring and which are the most important? By definition, every key performance indicator should matter, but not all KPIs are created equal.
You can also download these charts as slides and/or the whole study as a PDF.
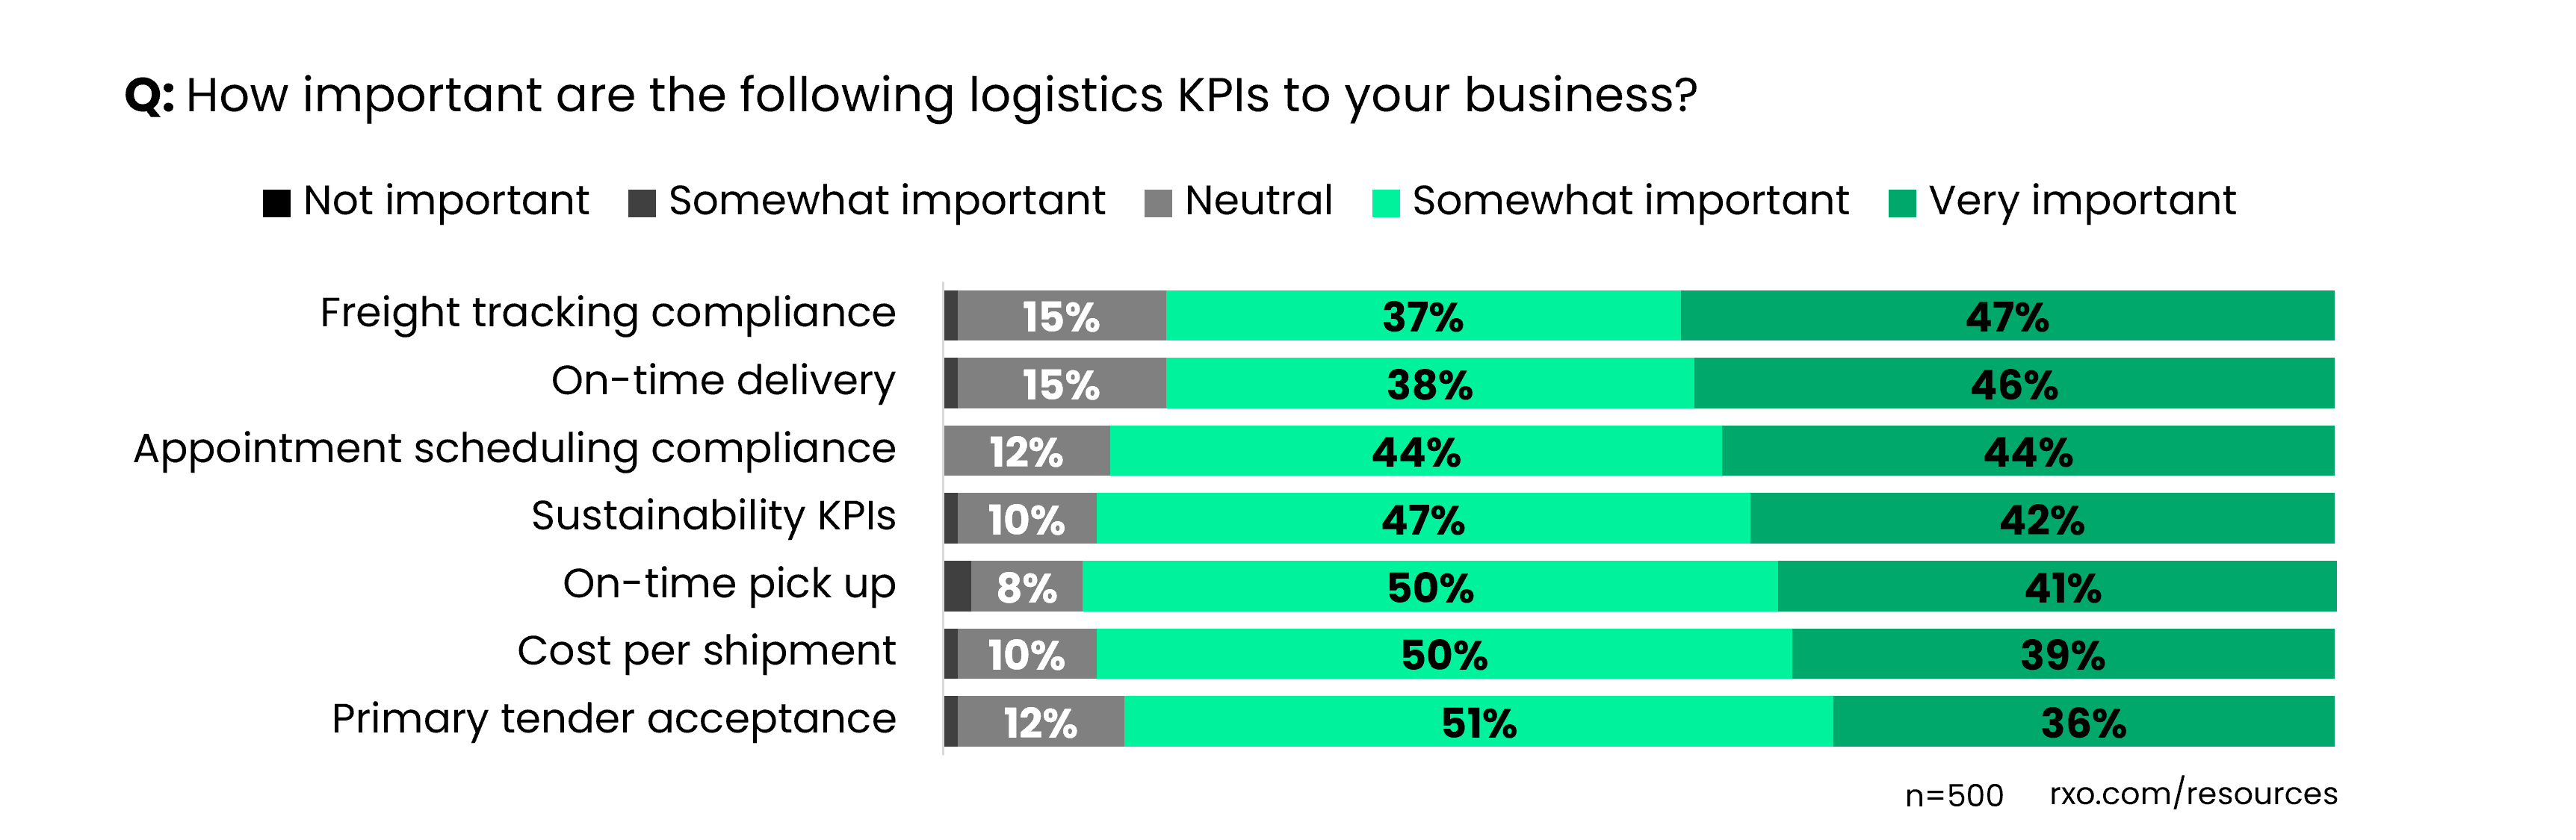
Going off of the percentage of shippers who stated a KPI was very important, here are the top seven logistics KPIs:
- Freight tracking compliance
- On-time delivery
- Appointment scheduling compliance
- Sustainability KPIs
- On-time pick up
- Cost per shipment
- Primary tender acceptance
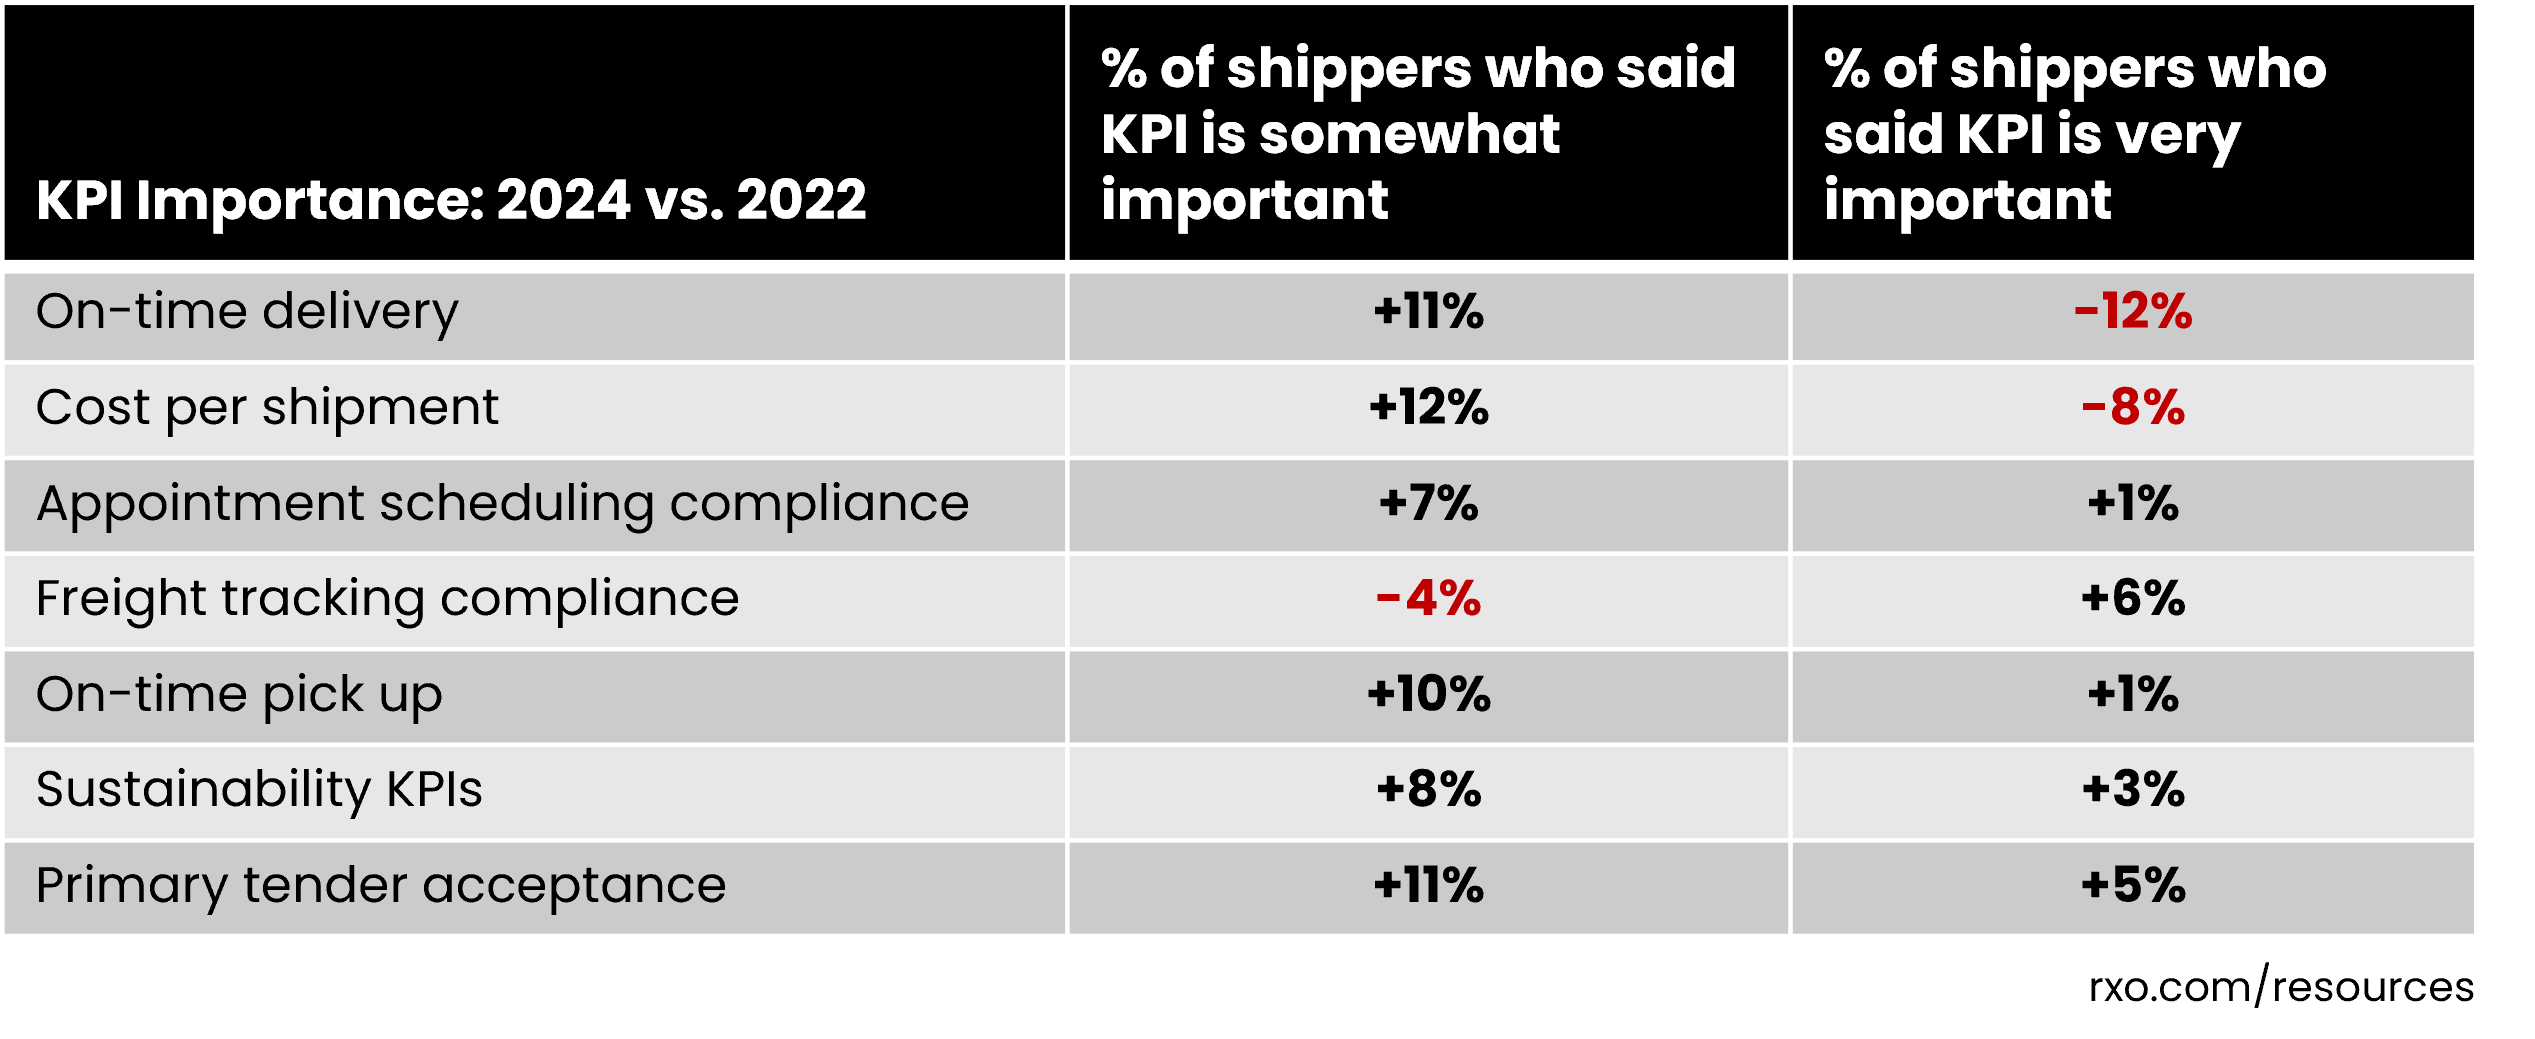
2022 vs. 2024: what’s up, what’s down?
In 2022, as shippers were coming off the peak of COVID-era supply chain volatility, their biggest concern was simply getting their product from A to B, everything else was negotiable.
As a result, there was one clear winner that stood out over the rest: on-time delivery. 58% of respondents said it was very important, making it the only KPI where a majority agreed.
In 2024, while shippers still felt on-time delivery was a top KPI (second overall looking at very important votes only), it wasn’t the runaway favorite. In fact, there was no runaway favorite at all.
Looking at the percentage of respondents who rated a KPI as very important, the difference from first place (freight tracking compliance) to seventh (primary tender acceptance) was only 11% — that was the same spread from first to second in 2022.
Fast forward to today, and shippers are enjoying much more stability with both rates and capacity. This has led to a slight easing of delivery performance and cost from very important to somewhat important, while appointment scheduling compliance, sustainability, on-time pick up and primary tender acceptance all took bigger leaps forward.
Cost vs. Performance in Freight Shipping
If you ask a shipper, “What’s more important, lower cost or high-performance service?” the most likely answer is: yes.
But you can’t always have both.
Sometimes shippers need to decide which to prioritize when choosing a mode, a carrier or shipping service. It’s the quintessential debate for all supply chain professionals: How do I provide the best service to my customers while protecting my freight budget?
As supply chain has moved from a back-office cost center to the forefront of strategic corporate planning, many businesses have been reorganizing their strategies to focus on service, with 65% of respondents placing a premium on performance over sheer cost-cutting.

Though this is still a solid majority, it’s 12% less than in 2022. After two years of relative supply chain stability, some shippers are more comfortable with bringing their budgets back in line to pre-pandemic levels.
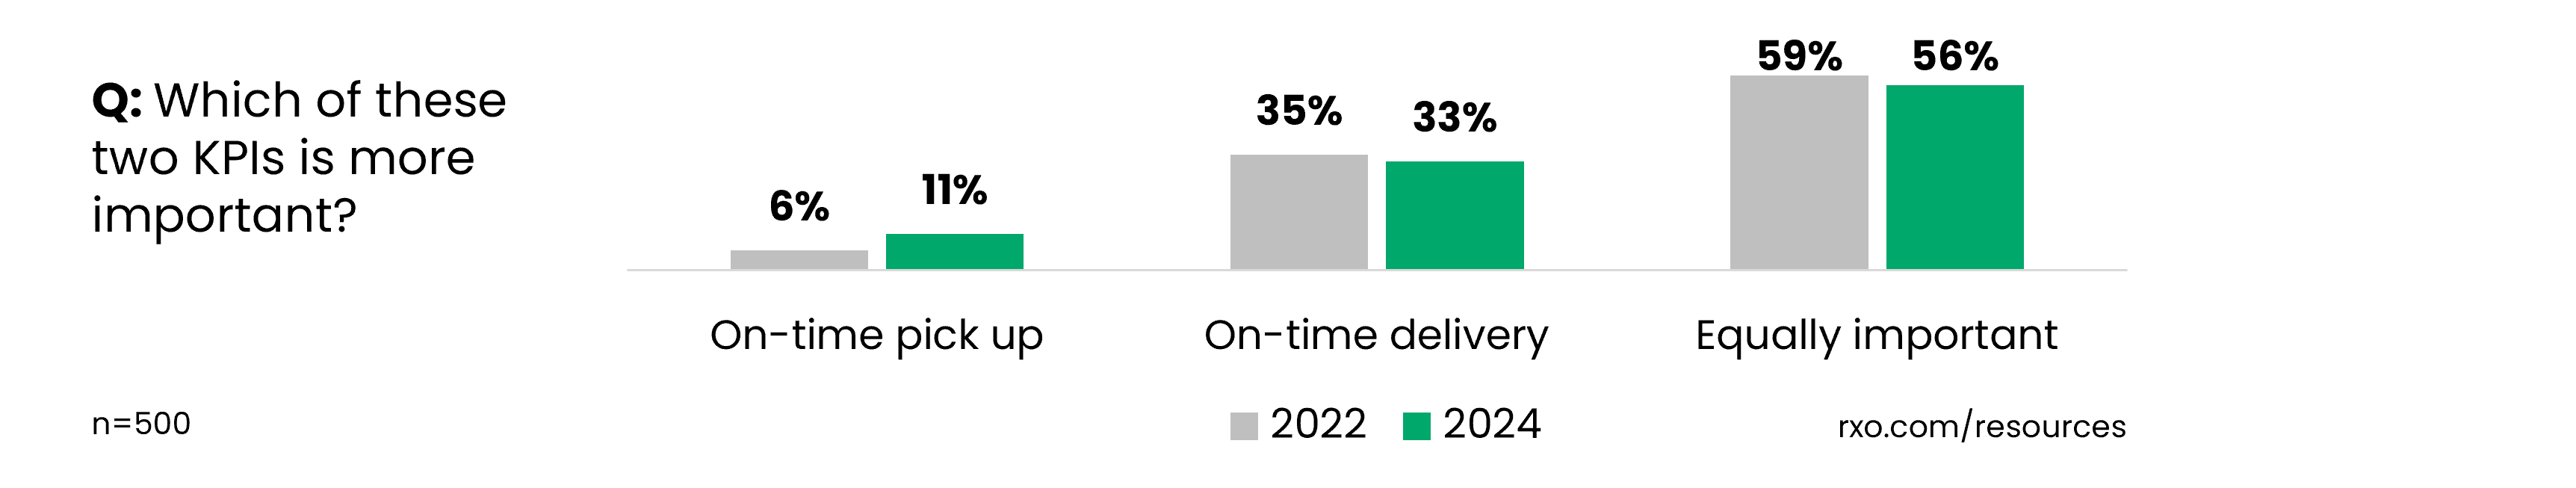
Delivery vs. Pick-up in Freight Shipping
Similar to the cost vs. service divide, if you ask a shipper if they want on-time pick-up or on-time delivery, they’re likely to say, “both”.
And the data proves it. When pitting pick-up and delivery against each other head-to-head, 56% of respondents said they were equally important. For shippers who put a stake in the ground, more felt that delivery (33% of respondents) was more important than pick-up (11%).
Interestingly, this is at odds with what we saw in the overall importance rankings, where pick up edged out delivery. However, we can see that in this head-to-head match up, delivery still lost ground to pick ups compared to 2022 (delivery was down -2%, pick ups gained 5%).
Carriers also have recognized the shifting priority towards on-time pick up performance, with pick ups gaining 16% and delivery dropping 12%.
Setting Logistics KPI Benchmarks:
What Shippers & Carriers Think About
Transportation Performance Standards
Both the supply and demand sides of the market have been on an unprecedented roller coaster over the past four years.
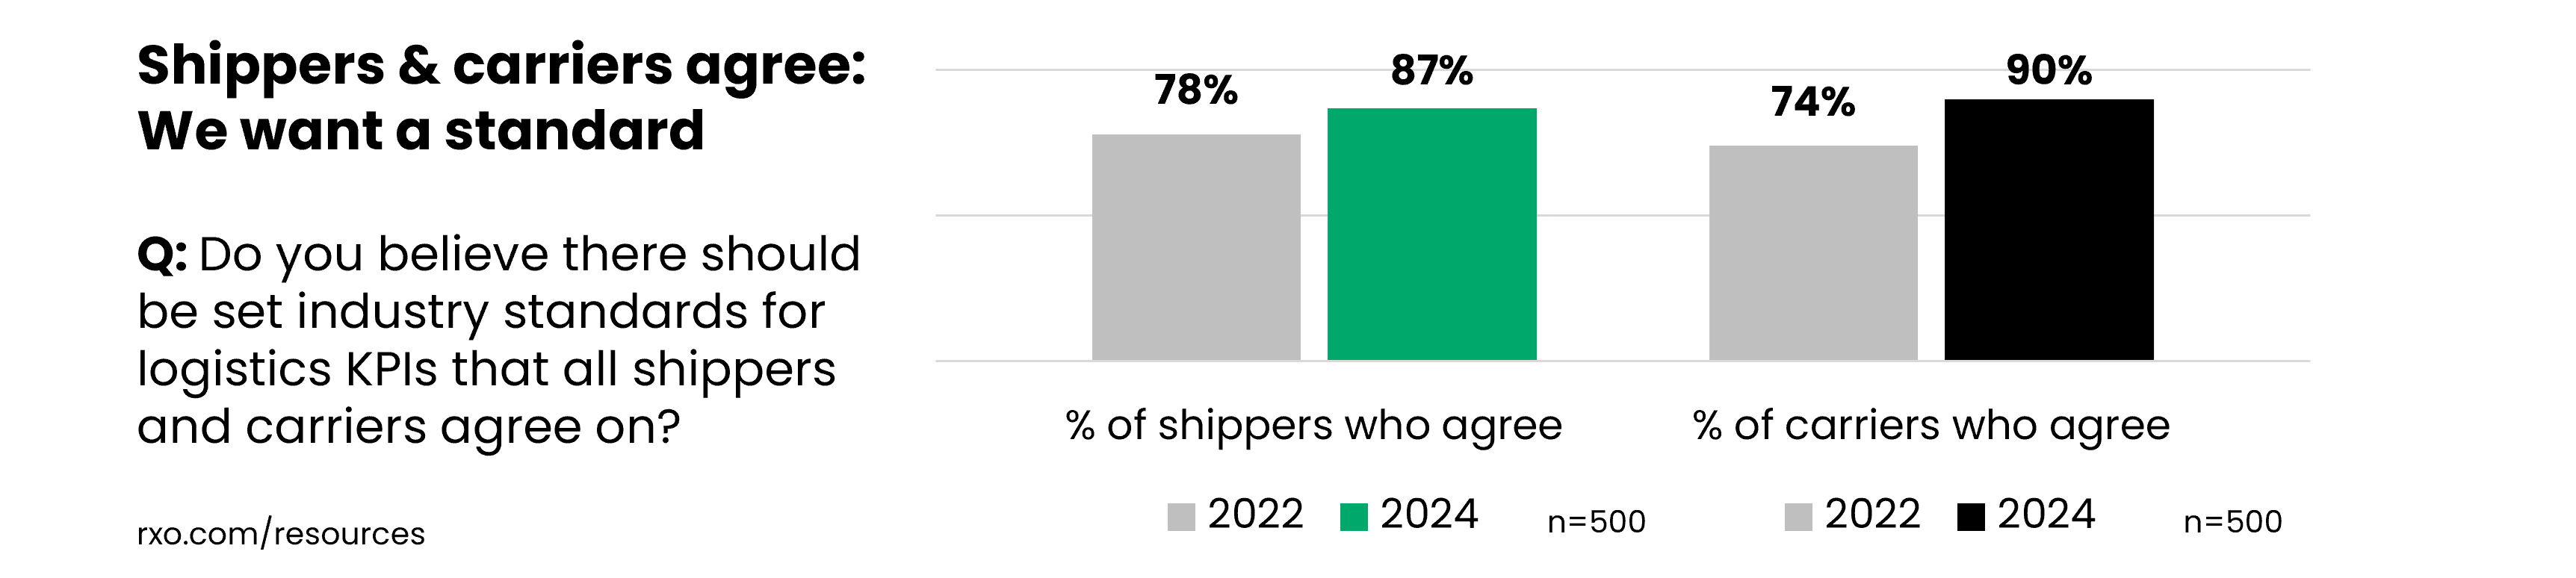
Whether we’re in a shippers’ market or a carriers’ market, both sides are craving stability. There is a near universal call for a standard, and it’s only getting louder.
87% of shippers and 90% of carriers agree there should be set industry standards for KPIs, up from 78% and 74% in 2022, respectively.
Furthermore, not only does everyone want a standard — 89% of shippers and 90% of carriers agreed that both sides should be held accountable for hitting logistics KPIs.
But what actually is a reasonable standard for these core transportation metrics?
We asked shippers and carriers to break down what they consider acceptable performance across the core logistics KPIs.
Use these insights from hundreds of your peers to critically examine your own standards.
What is acceptable on-time pick up performance in freight shipping?
Shippers and carriers were closely aligned on their expectations — the most commonly selected choice for both at 95% was on-time performance.
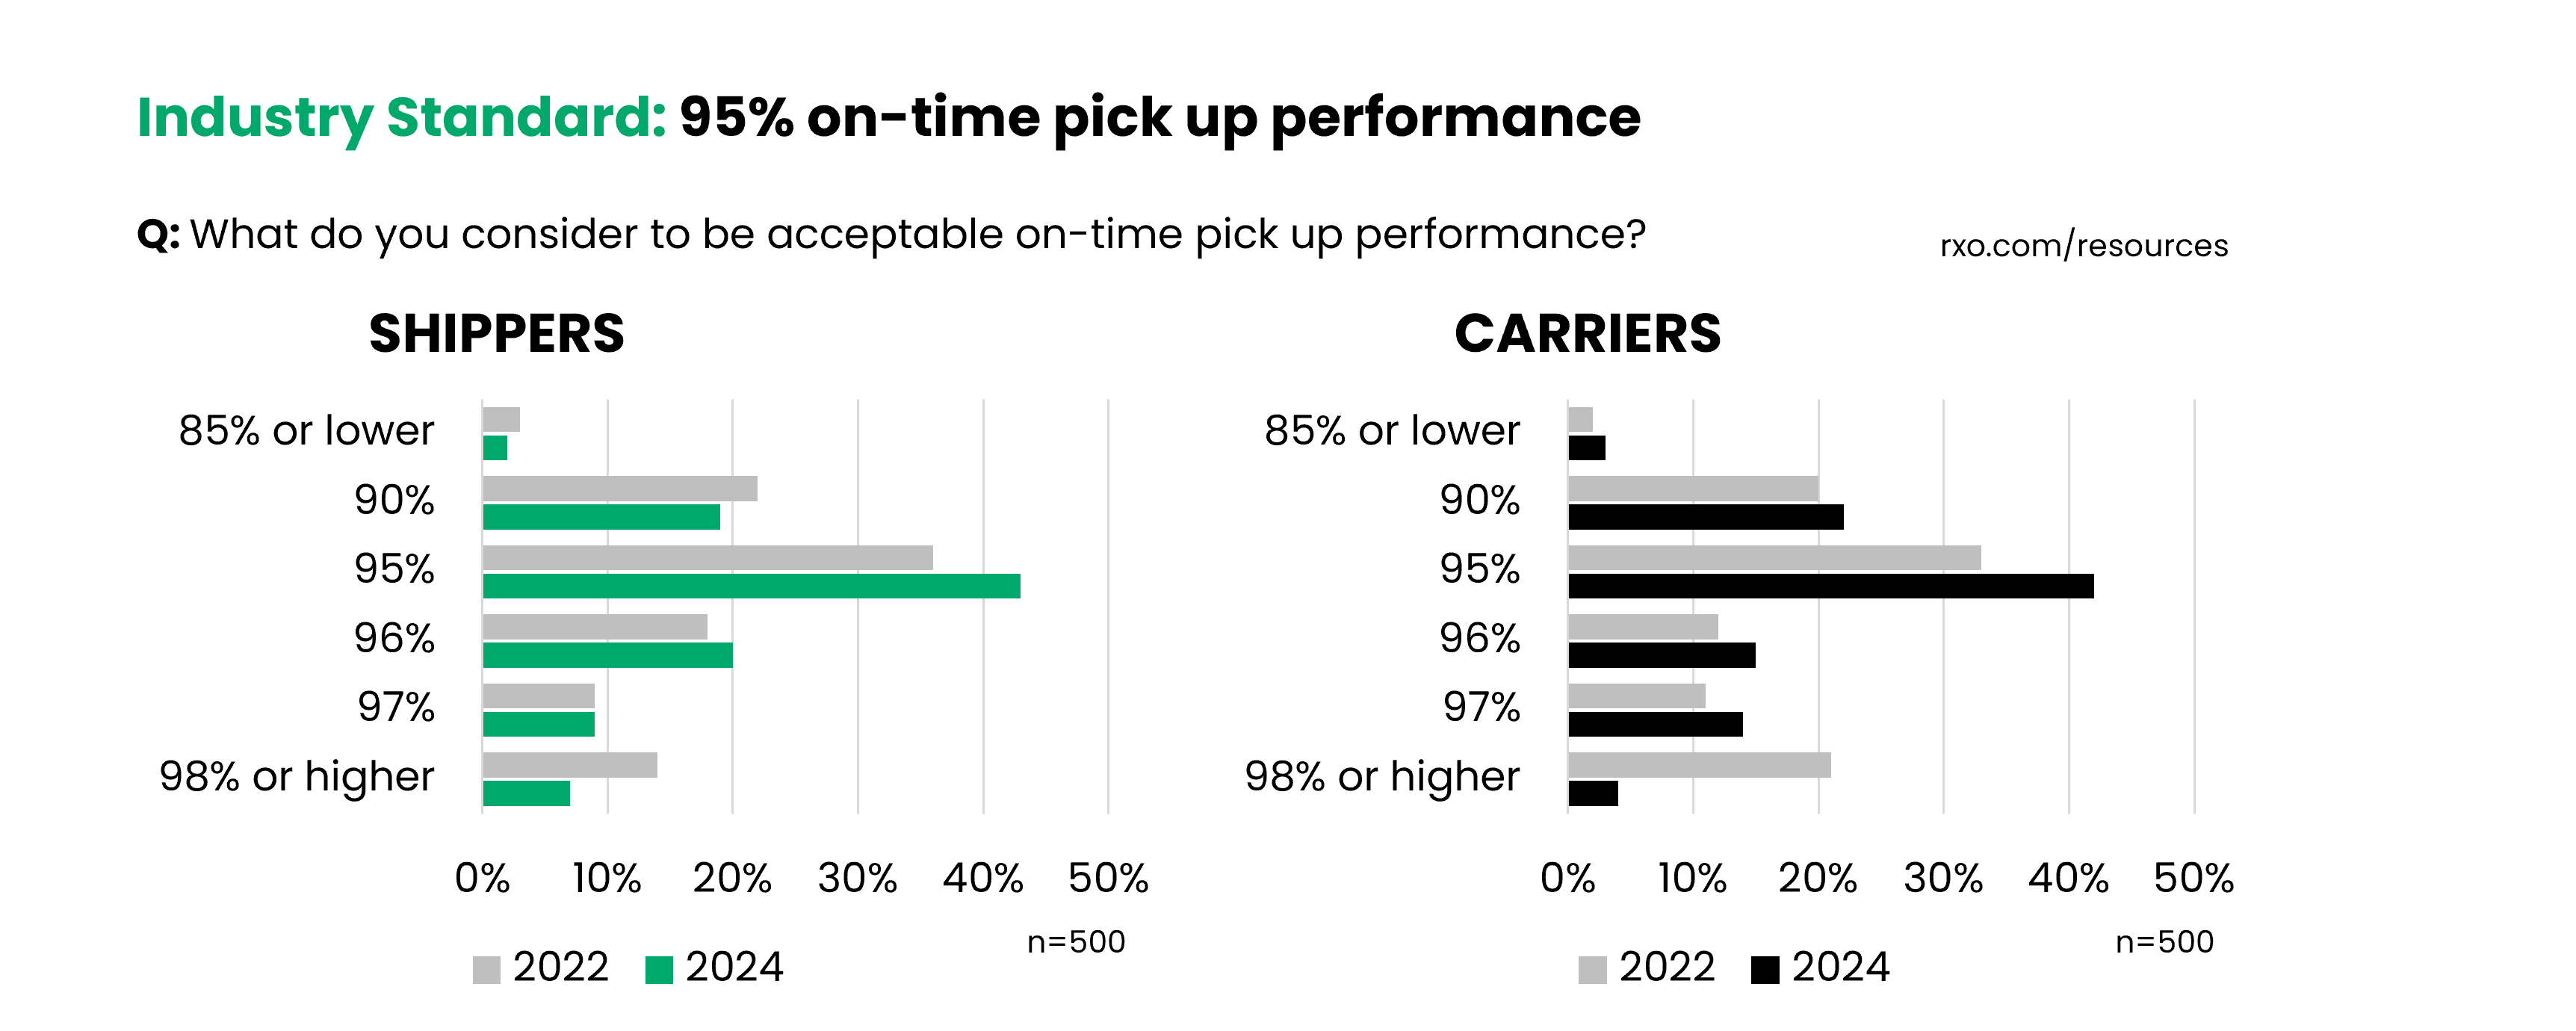
You can also download these charts as slides and/or the whole study as a PDF.
While 36% of shippers expected 96% on-time performance or better (down from 41% in 2022), a majority of respondents felt that is too demanding.
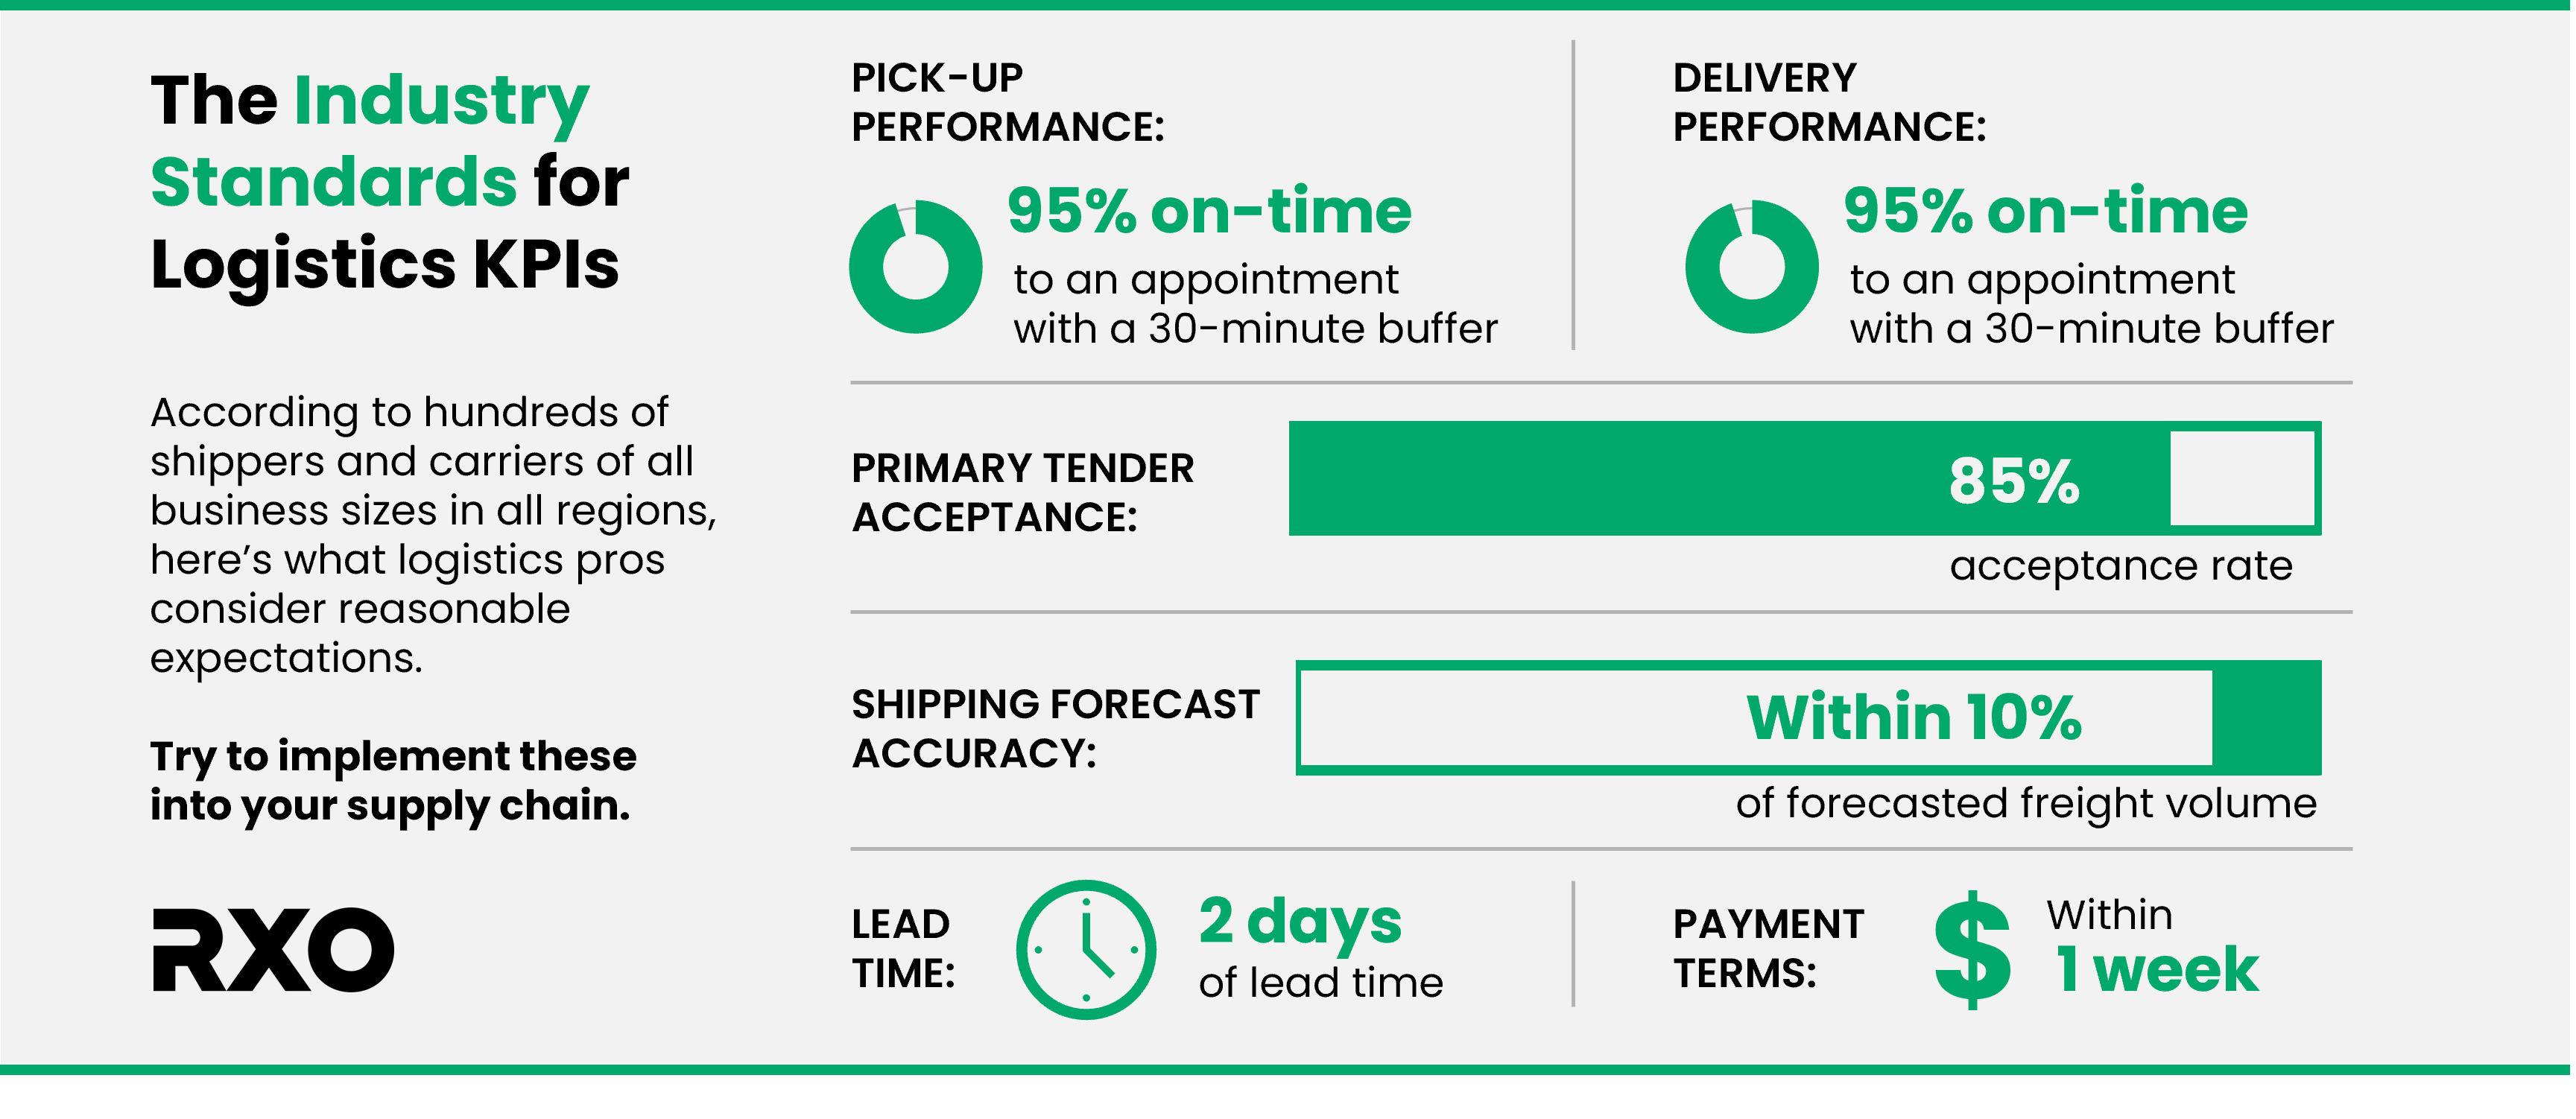
- Industry Standard: 95% on-time pick up performance.
- Change from 2022: no change in the standard, but underlying data shifted to be slightly more lenient.
What counts as an “on-time” pick up in freight shipping?
When thinking about on-time performance, the obvious next question is “what do you consider to be on time?”.
55% of shippers measure on-time performance to an appointment (down from 68% in 2022), while 45% measure on-time to the day.
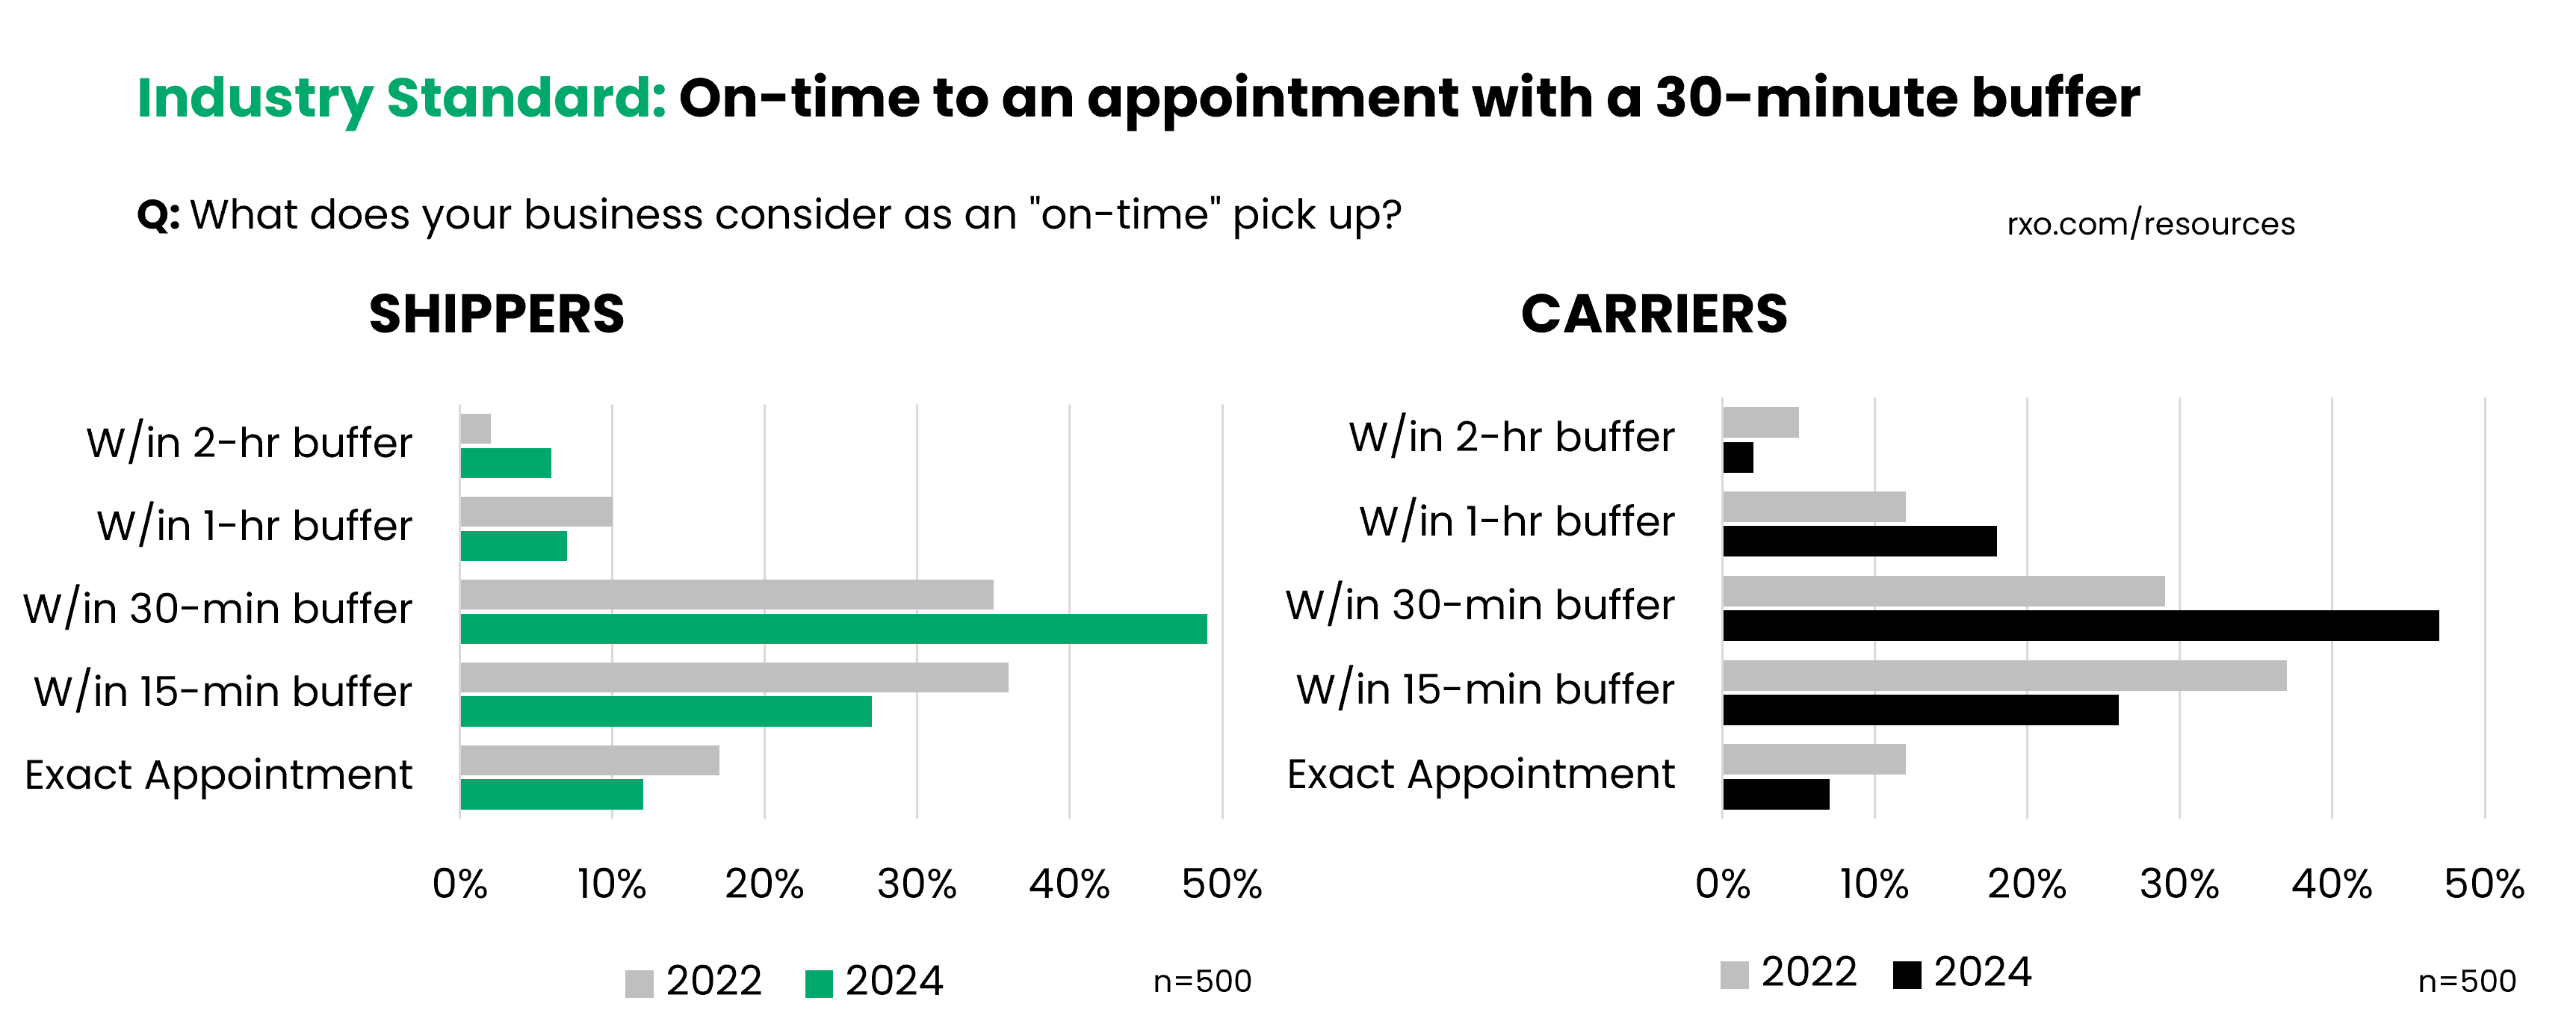
For those that measure on-time to the appointment, only 12% require carriers to be exactly on-time (down from 17%). The other 89% give at least some buffer, which is something 93% of carriers expect.
A 30-minute buffer was the most commonly selected choice for both shippers (49%, up from 35%) and carriers (47%, up from 29%).
- Industry Standard: On-time to an appointment with a 30-minute buffer
- Change from 2022: No change in the standard, but underlying data shifted to be more lenient.
What is acceptable on-time delivery performance in freight shipping?
Similar to pick-up expectations, 95% on time was the most common choice for both shippers (38%) and carriers (37%).
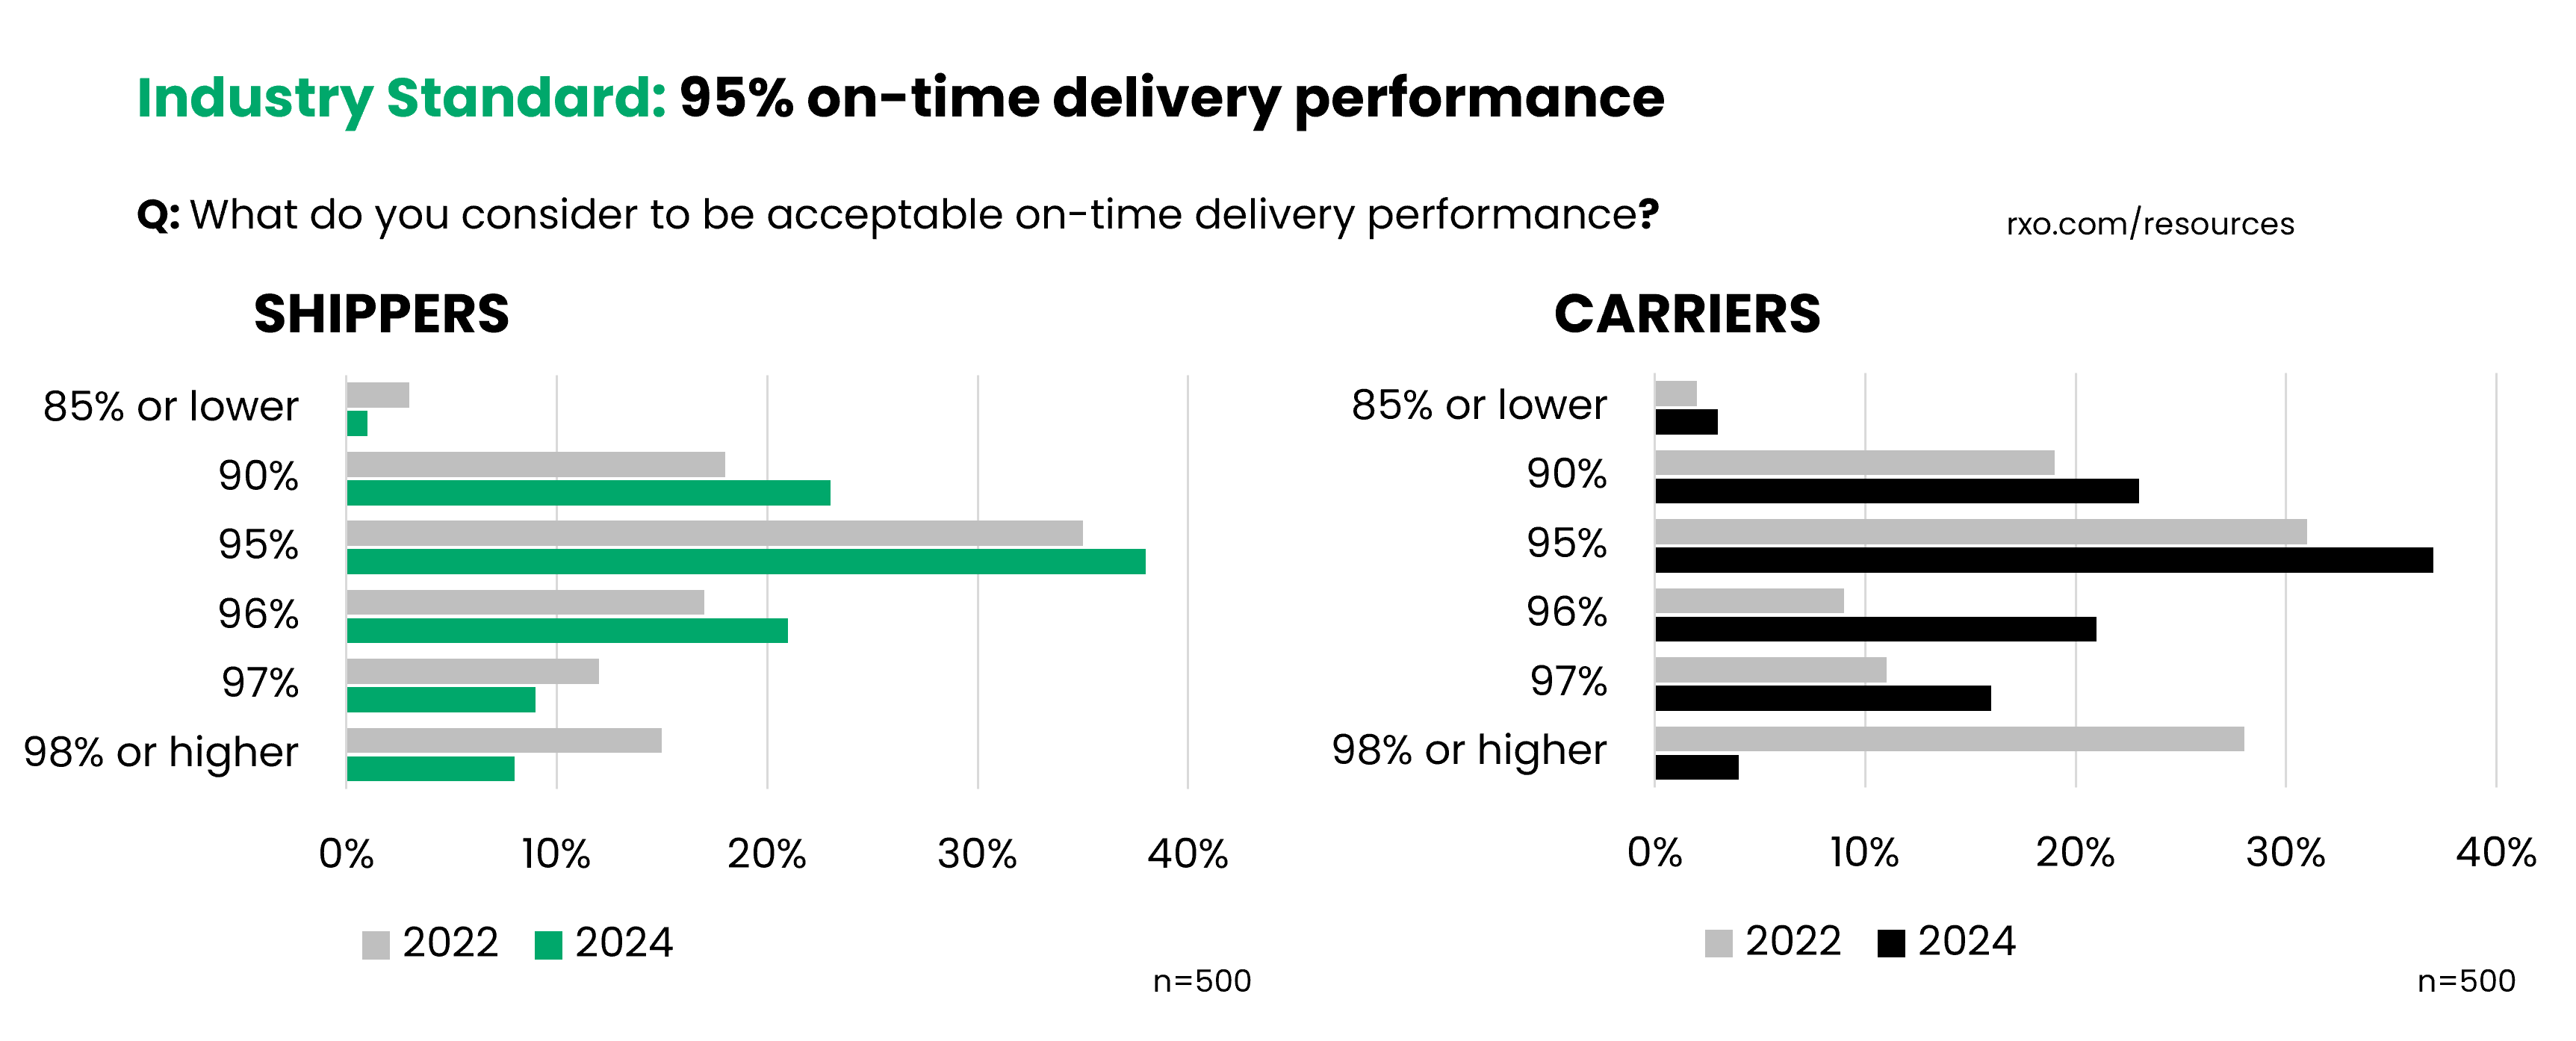
While 38% of shippers and 41% of carriers expected a 96% or greater on-time delivery performance (down from 44% and 48% in 2022, respectively), a majority of respondents found that to be too demanding.
- Industry Standard: 95% on-time delivery performance
- Change from 2022: no change in the standard, but underlying data shifted to be slightly more lenient.
What counts as an “on-time” delivery in freight shipping?
Once again, what shippers and carriers consider to be “on-time” for deliveries nearly mirrors their expectations for pick-ups.
54% of shippers measure on-time performance to the appointment (down from 67%).
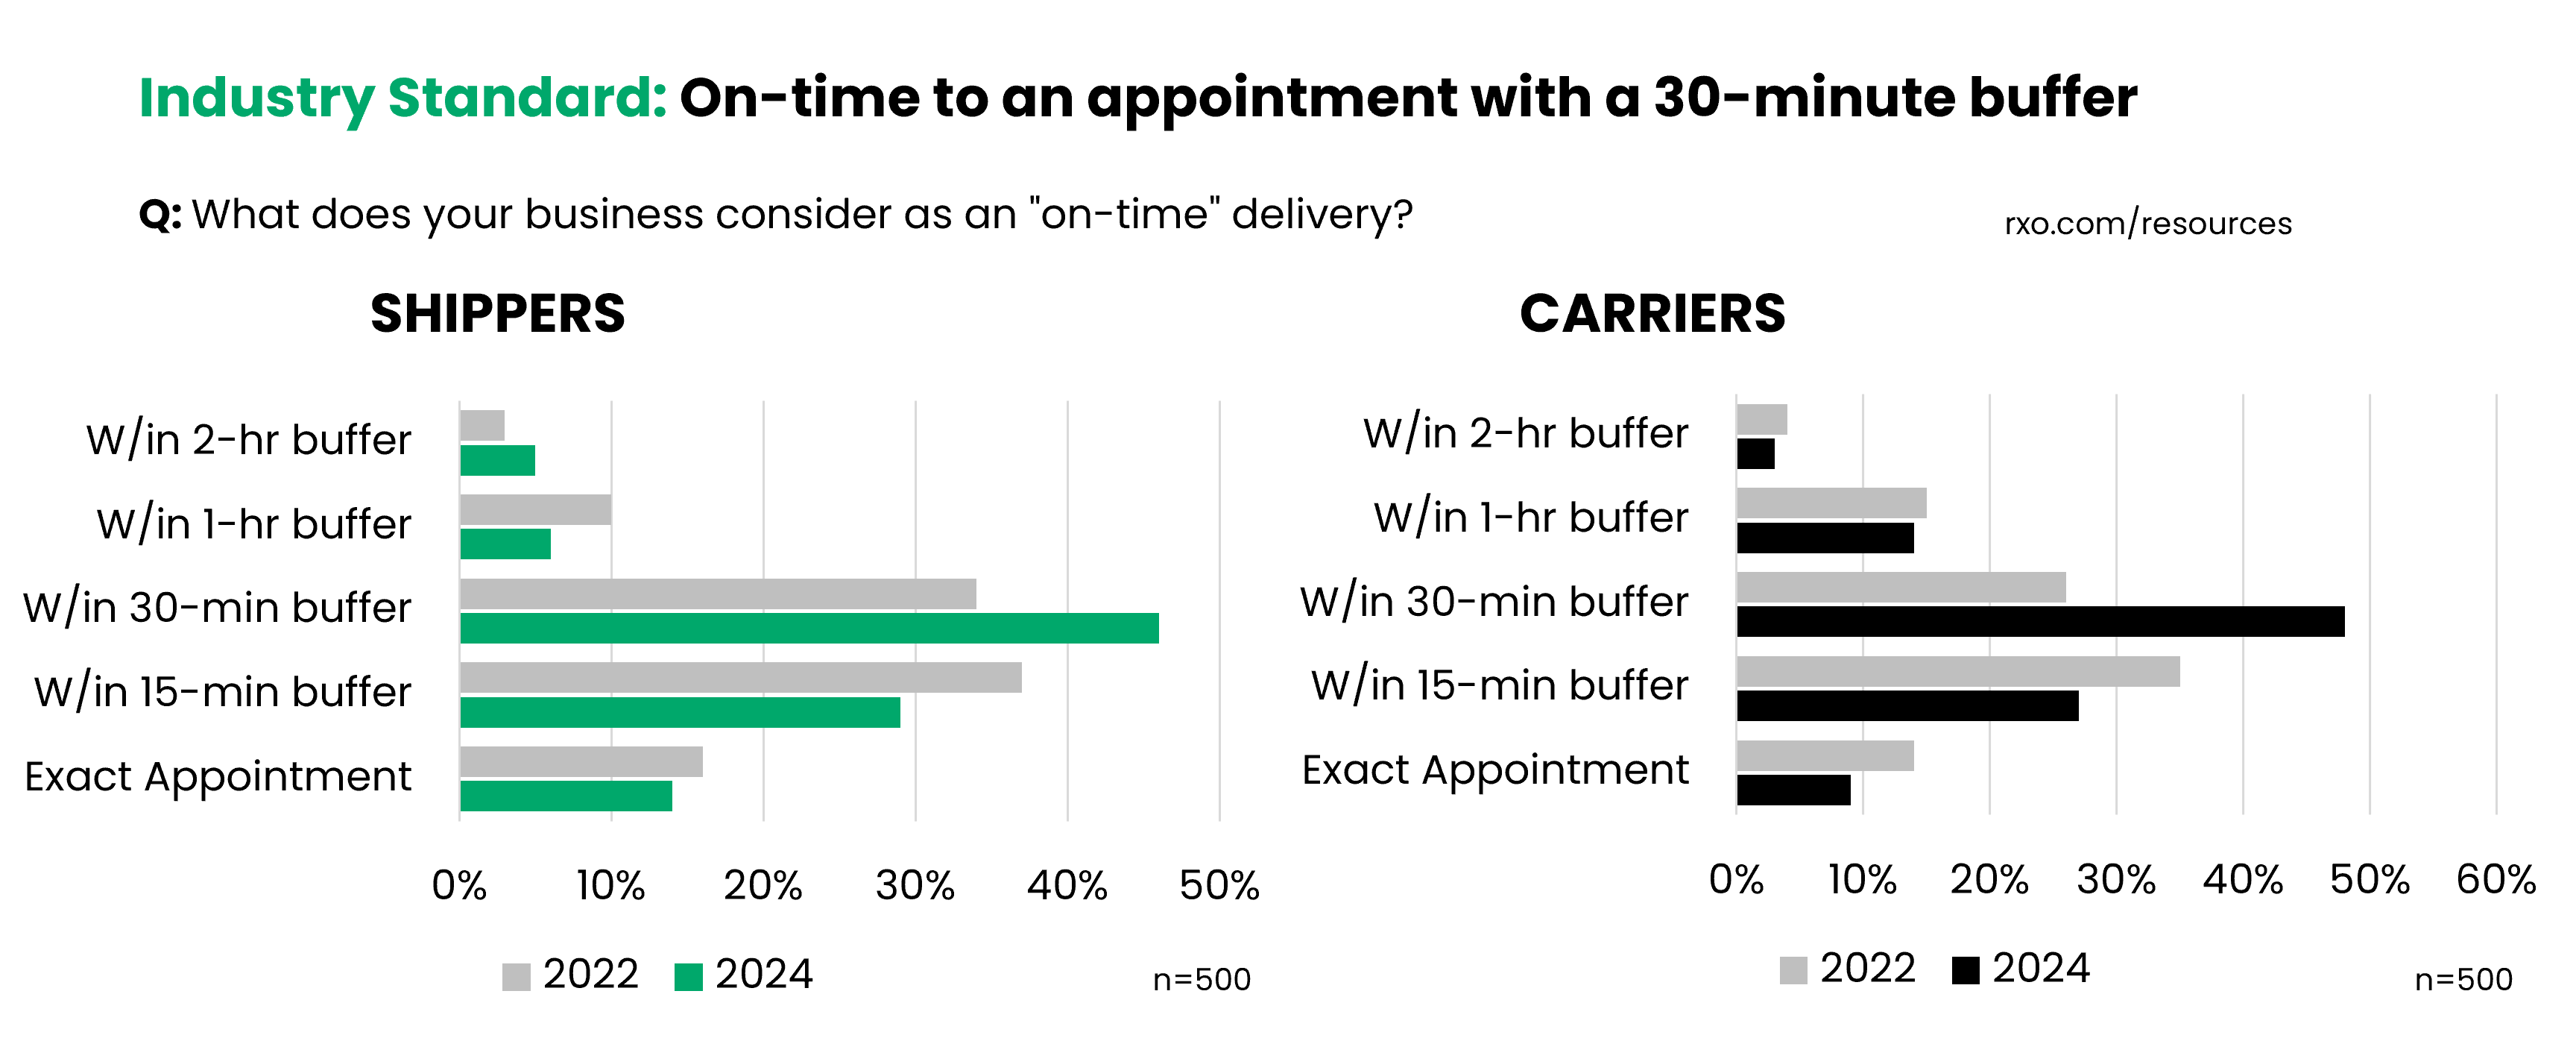
Of the businesses that measure to the appointment, 86% of them offer at least some buffer, and 92% of carriers expect one.
- Industry Standard: On-time to an appointment with a 30-minute buffer
- Change from 2022: No change in the standard, but underlying data shifted to be slightly more lenient.
How accurate should demand forecasting be in freight shipping?
An essential part of maintaining strong freight provider relationships is accurate capacity planning.
If a carrier wins a lane in a bid for 50 weekly shipments, and only gets 15, it’s a serious problem for their network. Conversely, if a shipper awards 15 weekly shipments but has 50, it creates an equal, but opposite, problem.
Demand forecasting is as much art as it is a science, and a myriad of factors go into whether or not it will be accurate. But everyone can agree it’s never going to be perfect.
Since it is such a critical component of how shippers and carriers plan out their networks, we wanted to see what each side thought was a reasonable amount of variance.
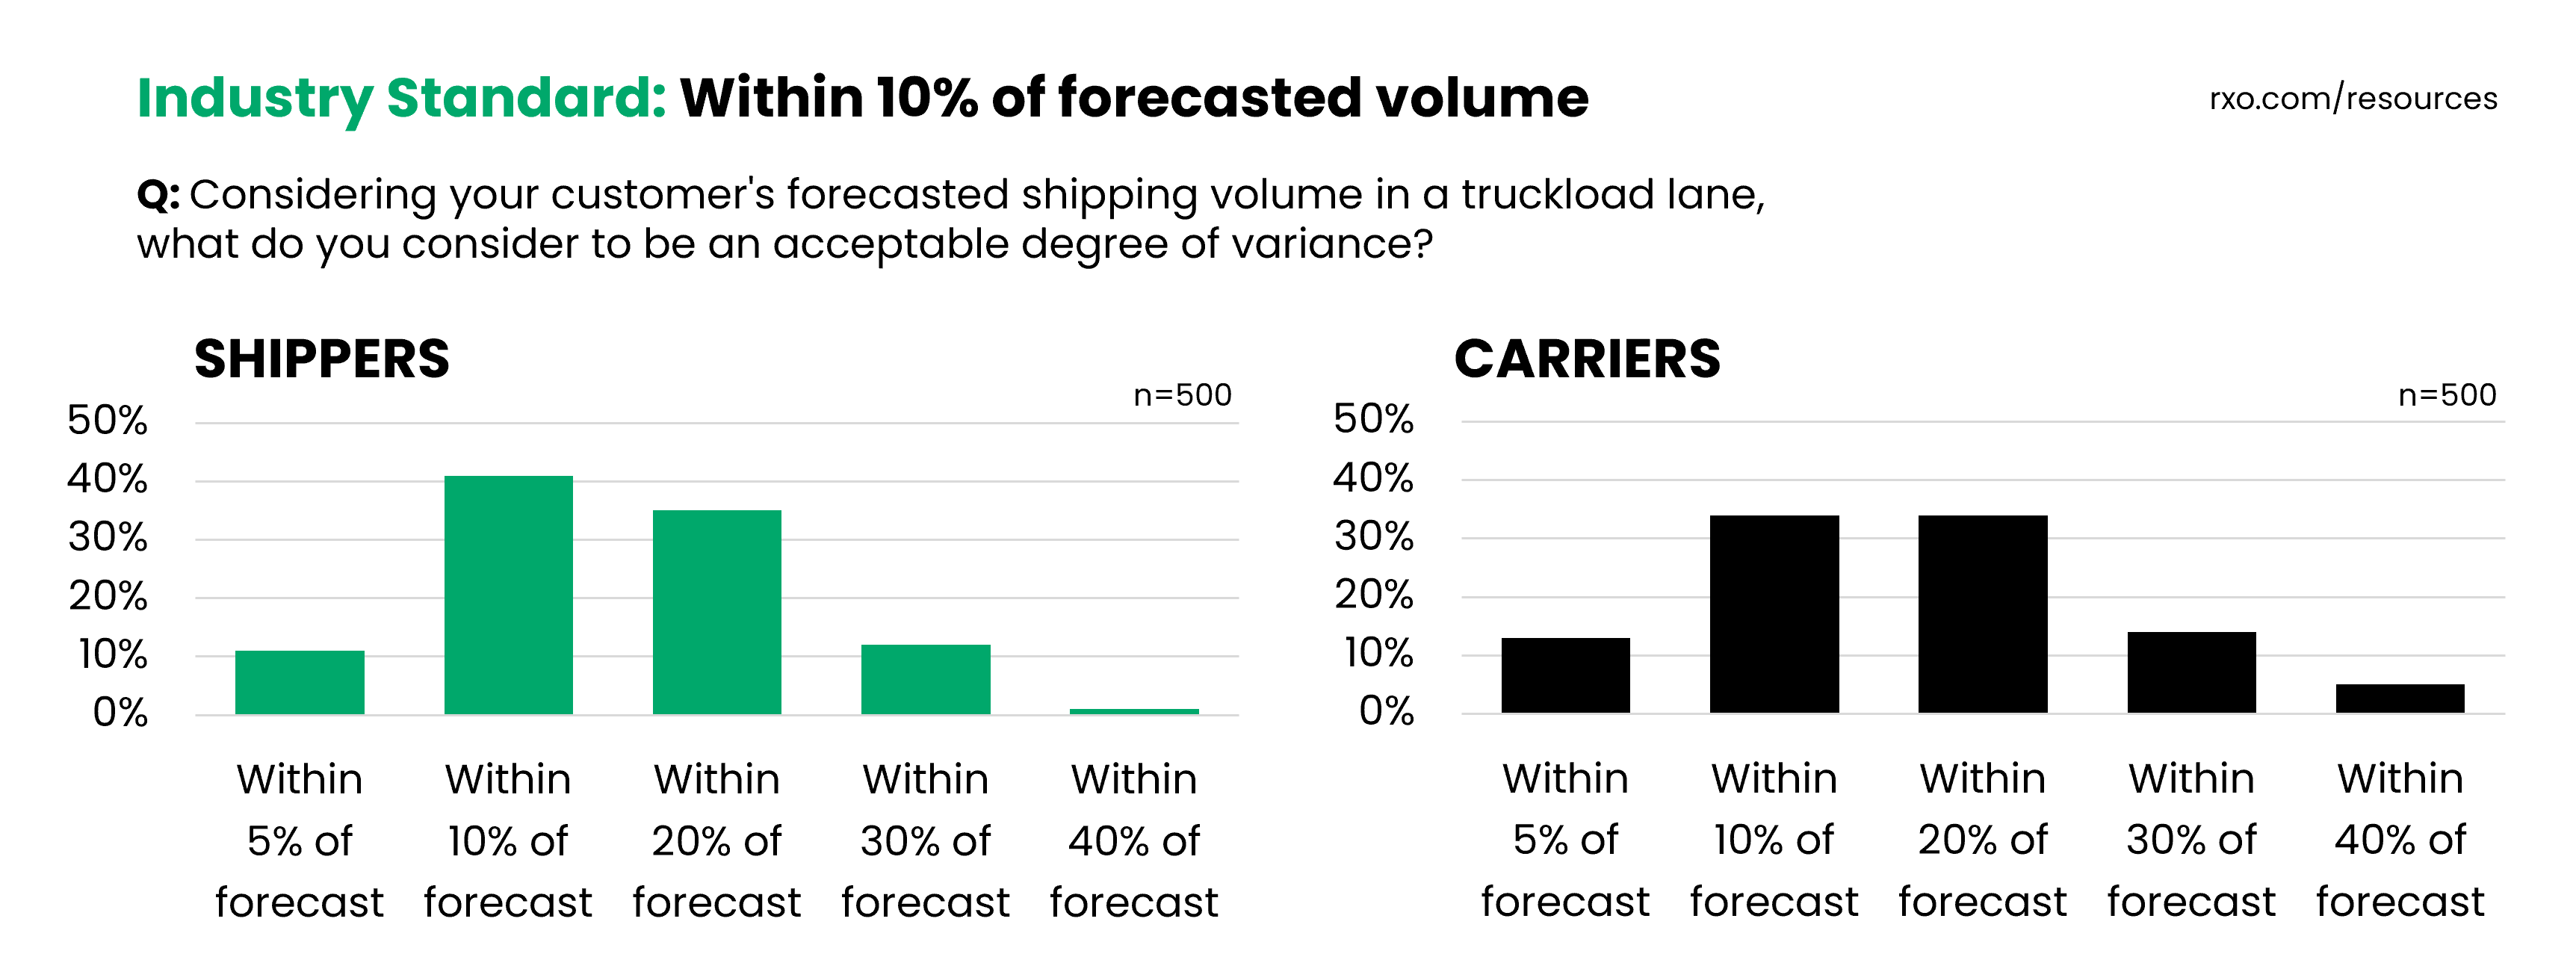
According to 1,000 supply chain professionals, within 10% of forecasted volume was the most likely choice, with 41% of shippers and 34% of carriers.
However, while this high standard was the most likely choice, 48% of shippers and 53% of carriers thought that within 20% of forecasted volume or less was acceptable.
- Industry Standard: Within 10% of forecasted volume
- Change from 2022: N/A (new question)
What is an acceptable primary tender acceptance rate in freight shipping?
A sign that the market is heading toward rate inflation: a decrease in primary tender acceptance.
In a tighter capacity environment, the spot market offers lucrative opportunities to carriers, and they tend to accept less freight at contract rates set in a much softer market.
85% was the most common choice for an acceptable rate of primary tender acceptance for both shippers (35%) and carriers (33%), however 90% tender acceptance was a close second for both.
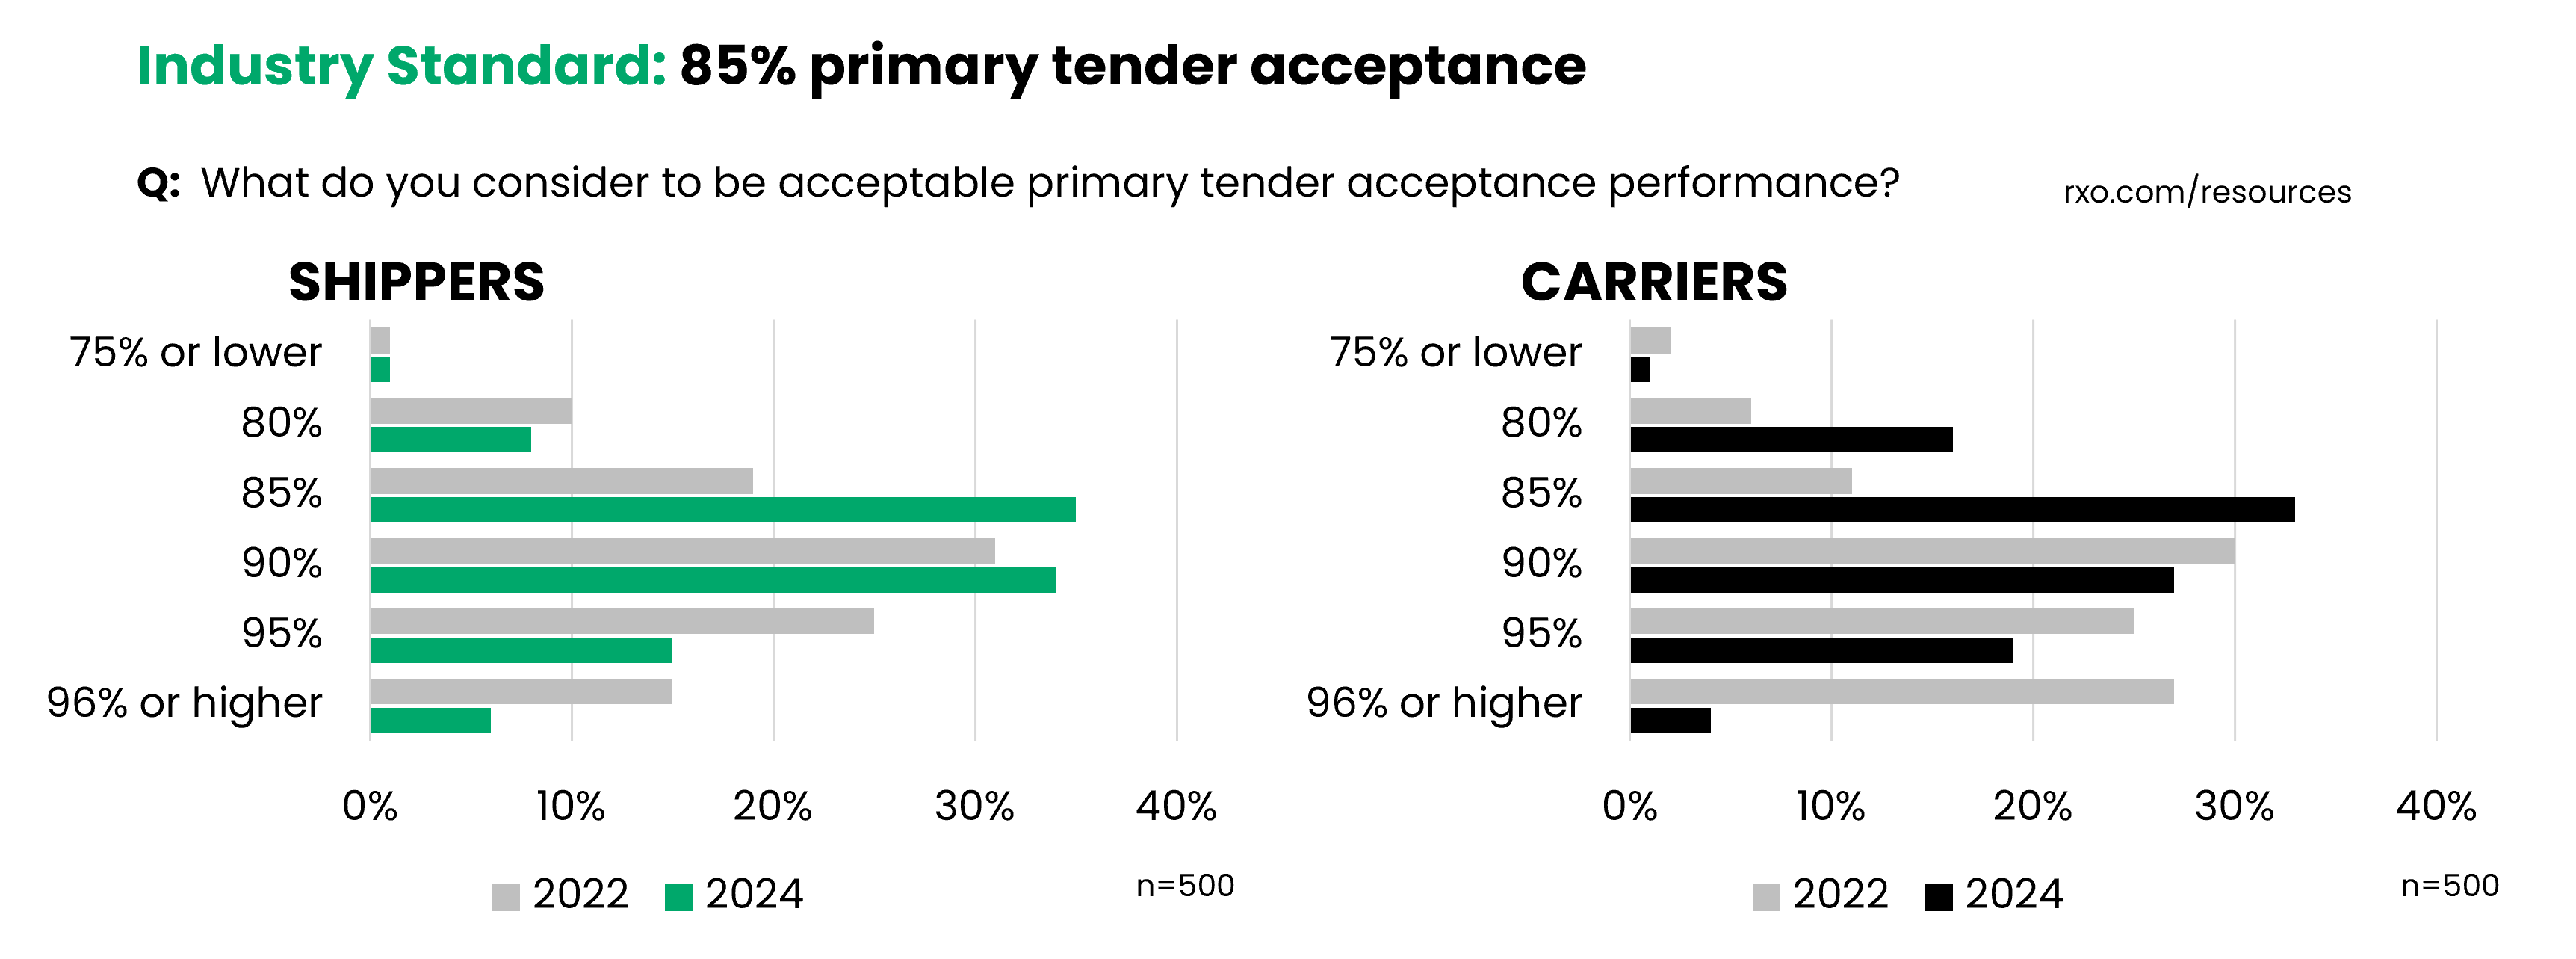
And while 55% of shippers and 50% of carriers expect 90% or higher performance, this has shifted down significantly from 2022, when 71% of shippers and 82% of carriers thought 90% or higher was acceptable.
In 2022, actual tender acceptance rates were generally much lower than today, yet expectations were higher — why the shift downwards? It could be a sign that shippers have taken guaranteed capacity for granted, and are less preoccupied with high tender acceptance.
When we get back to a carriers’ market, we will see if this shifts back up again.
- Industry Standard: 85% tender acceptance
- Change from 2022: Shift down from 90% tender acceptance
How much lead time is reasonable for truckload and LTL shipments?
This was a new question — how much lead time is reasonable?
The most common answer for both shippers (43% of respondents) and carriers (38%) was two days.
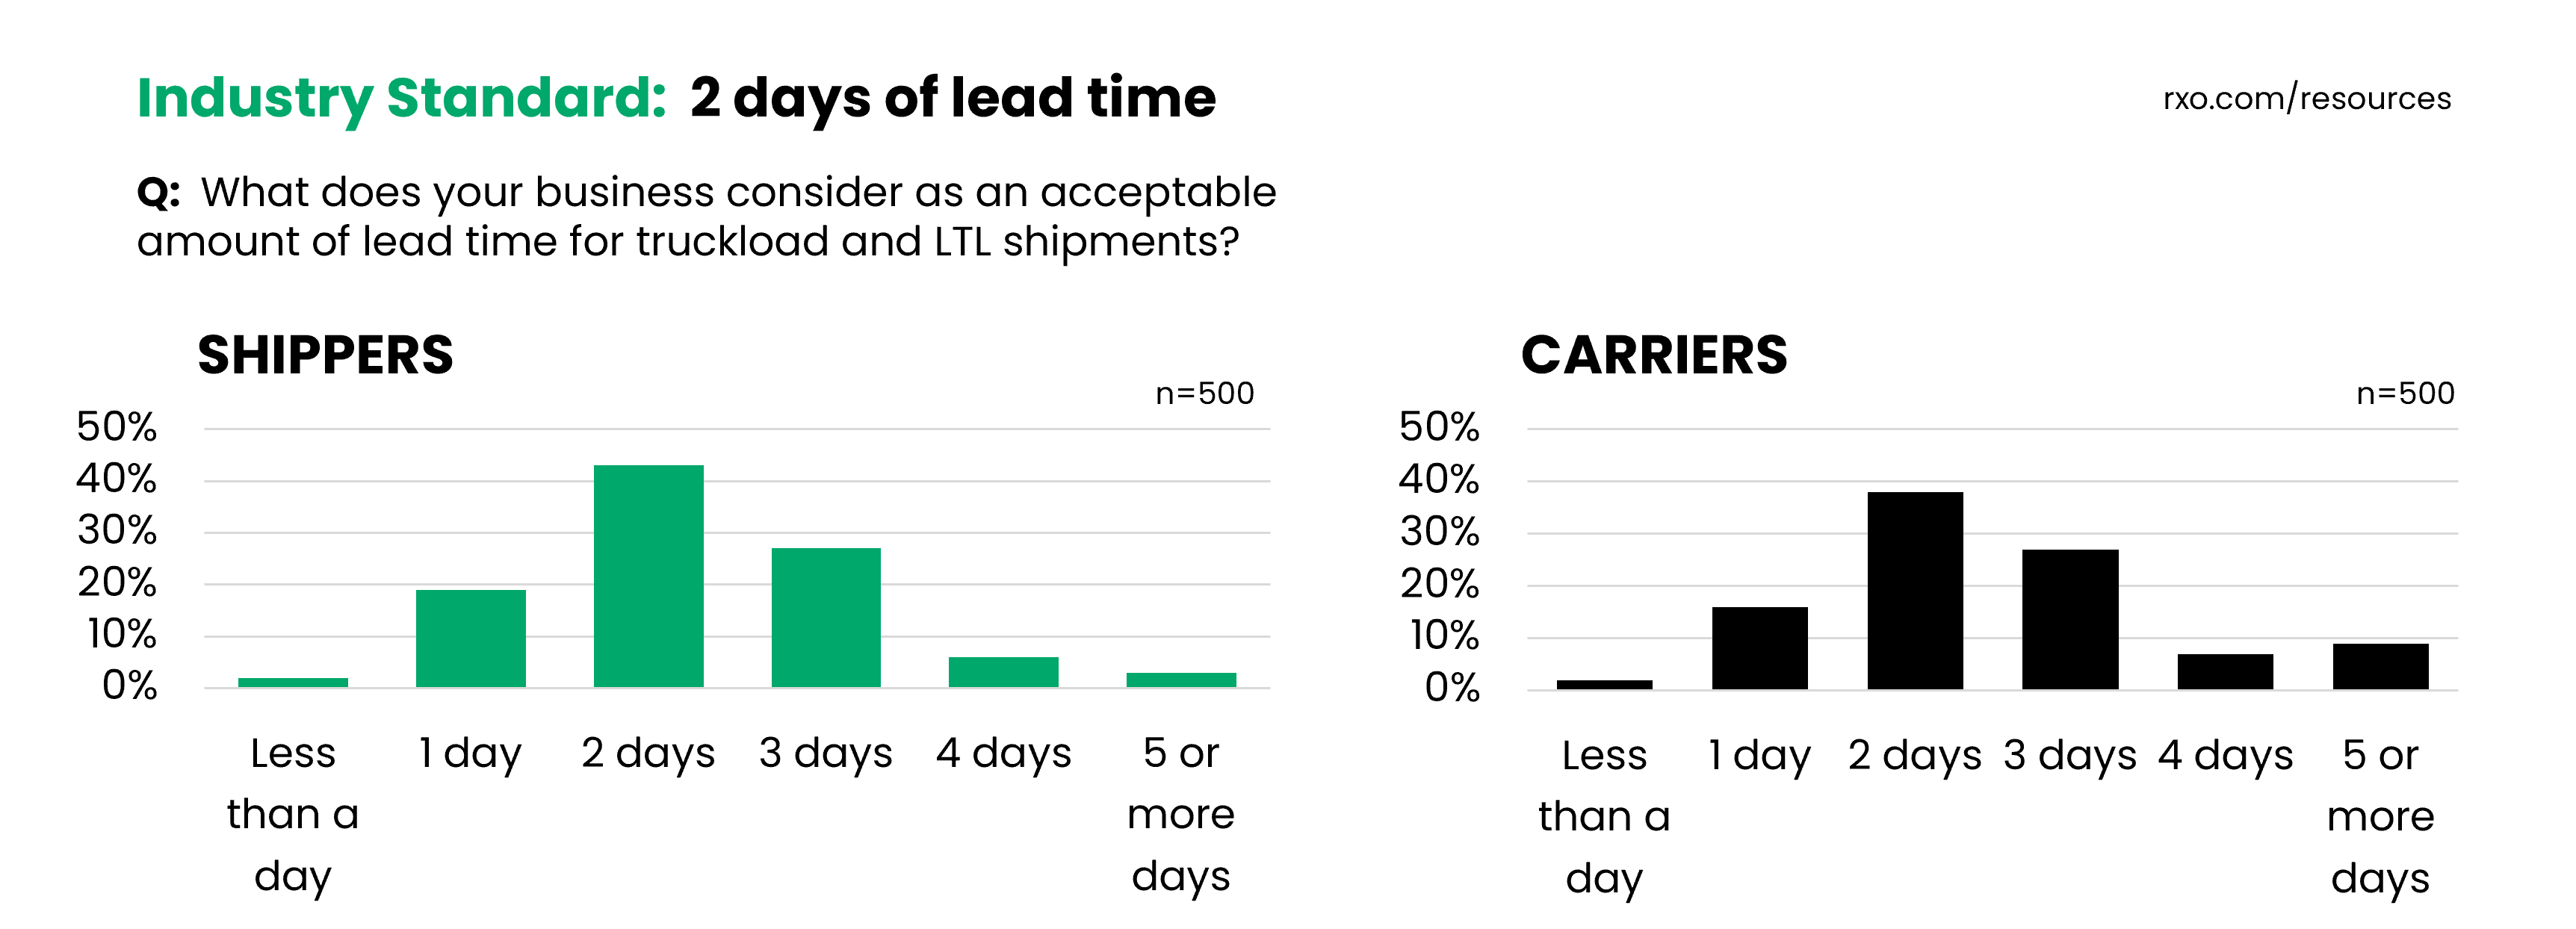
While there are going to be scenarios where a day or less lead time is necessary, it shouldn’t be considered a standard operating procedure — 79% of shippers and 81% of carriers expect at least two days of lead time, with a over a third of each expecting three or more days.
- Industry Standard: Two days of lead time
- Change from 2022: N/A (new question)
How fast should freight carriers get paid?
According to the American Trucking Association, 97% of the U.S. trucking industry is made up of carriers with 20 trucks or fewer.
For all businesses, cash flow is incredibly important, but for smaller carriers without easy access to financing, it is especially so, and many carriers cannot wait weeks to get paid.
They have drivers to pay and diesel tanks to fill. It’s no surprise that 92% of carriers expect to get paid within 30 days, and 66% expect to get paid within a week or less (up from 61% in 2022).
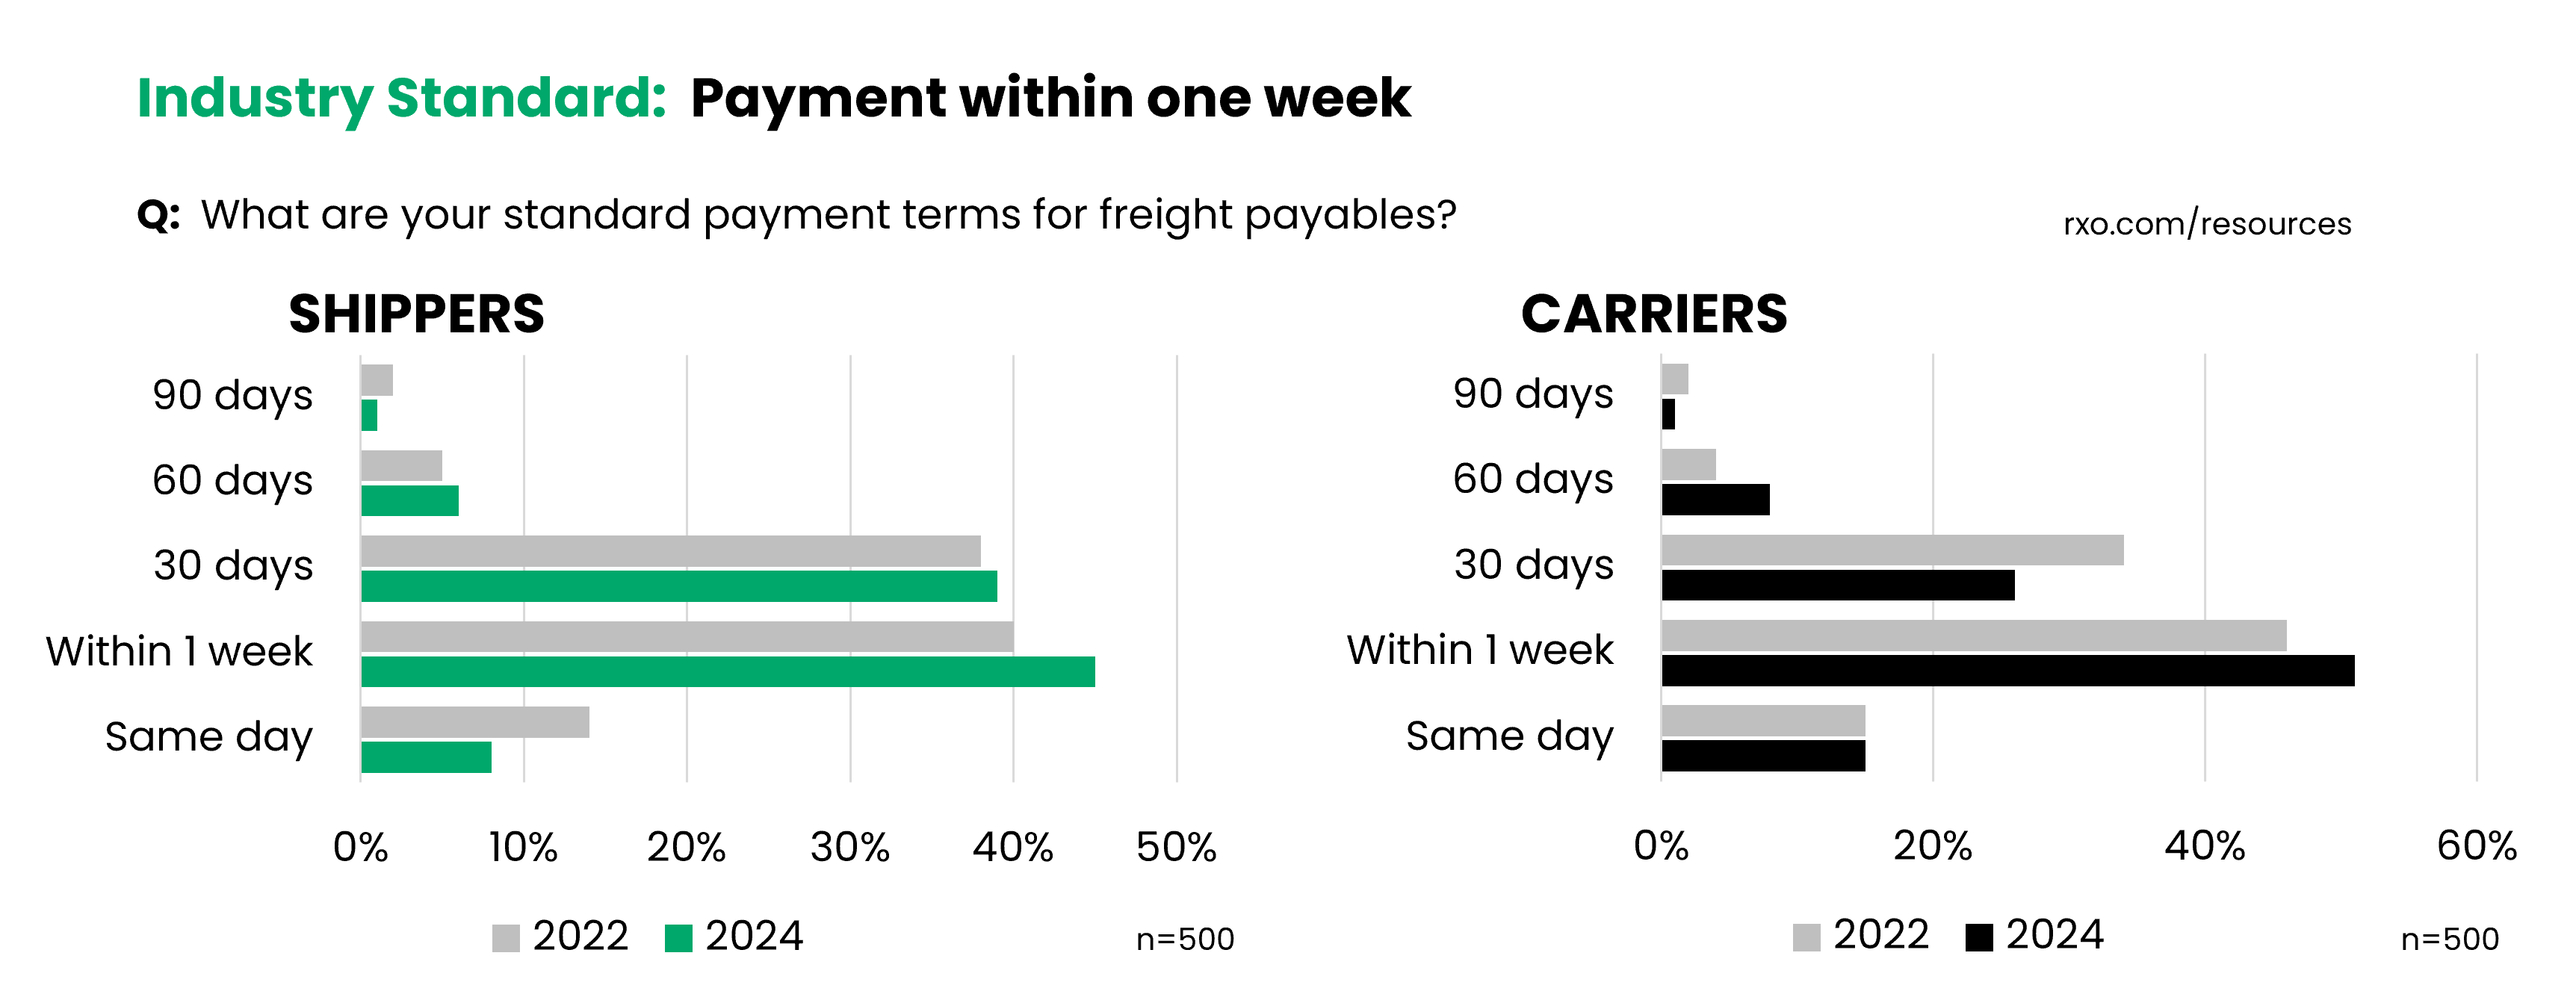
Shippers understand this, with 92% of respondents paying within 30 days and 53% paying within a week.
The most commonly selected payment benchmark for both shippers was within 1 week (45% of respondents, up from 40% in 2022) and carriers (51% of respondents, up from 46% in 2022) .
- Industry Standard: Within one week
- Change from 2022: No change
The Industry Standards for Logistics KPIs
We’ve gone through each KPI individually, so let’s recap what 1,000 shippers and carriers think are reasonable expectations for logistics performance.
While these insights are from businesses across different sizes and industries, they are not going to represent every business.
Supply chains are unique and complex — for each one of these KPIs, there were many respondents who thought the standard should be higher, others more lax.
That said, these benchmarks provide a guide when examining your own transportation metrics. If you find you’re way off from the norm, you could be exposing your supply chain to a higher risk of disruption.
Implementing these benchmarks into your transportation network can help you stand on firmer ground.
You can also download these charts as slides and/or the whole study as a PDF.
The Carrier’s Perspective:
KPI Insights For More
Strategic Carrier Relationships
With changing demand patterns, shifting industry norms, global trade instability, and the continued rise of ecommerce, supply chains have been on a wild ride over the past four years.
As shippers are trying to figure out the right blend of cost, service, technology, and human expertise, they are looking to their freight providers to help them keep up.
When asked how increasing demands for faster, cheaper shipping has impacted their KPI standards to carriers, 60% of shippers said they were more demanding with their carriers, up from 57% in 2022.
It’s called a supply chain — that means all participants, both shippers and carriers, are interconnected. We all work together to make and move the freight that keeps the world running.
Because working with 3PLs and carriers is such an integral part of shipping operations, it’s essential for shippers to use KPIs to build stronger, more strategic relationships with their network.
Now that we know the industry benchmarks, let’s dive deeper into how shippers can put that knowledge to use for more productive interactions with freight providers.
Carriers are getting more KPI-savvy, too.
We know that 89% of shippers think KPIs are important — do carriers? Yes.
Slightly more carriers (90%) think KPIs are an essential part of fleet management, up from 85% in 2022. Like their shipper counterparts, carriers are also getting more out of their metrics, and their rate of progress is even faster.
They are also getting better at tracking KPIs.
Virtually no one is at the starting line when it comes to tracking transportation metrics — 99% of carriers rate themselves as either intermediate or advanced at tracking logistics KPIs, up from 82% in 2022.
They are referencing KPIs (a lot) more often.
46% of carriers are referencing them daily, and 80% of carriers are referencing them at least weekly, up from 16% and 59% in 2022, respectively.
They are getting better at using that data too.
99% of carriers think they are either intermediate or advanced at taking action on the logistics KPIs they have, up from 81% in 2022. Furthermore, 49% think they’re advanced, compared to 26% in 2022.
Carriers Are All-in on Technology
Like shippers, we’ve clearly seen that carriers are getting more KPI-savvy — we can attribute at least some of that improvement to an increase in technology platform usage.

Less Manual, More Platforms
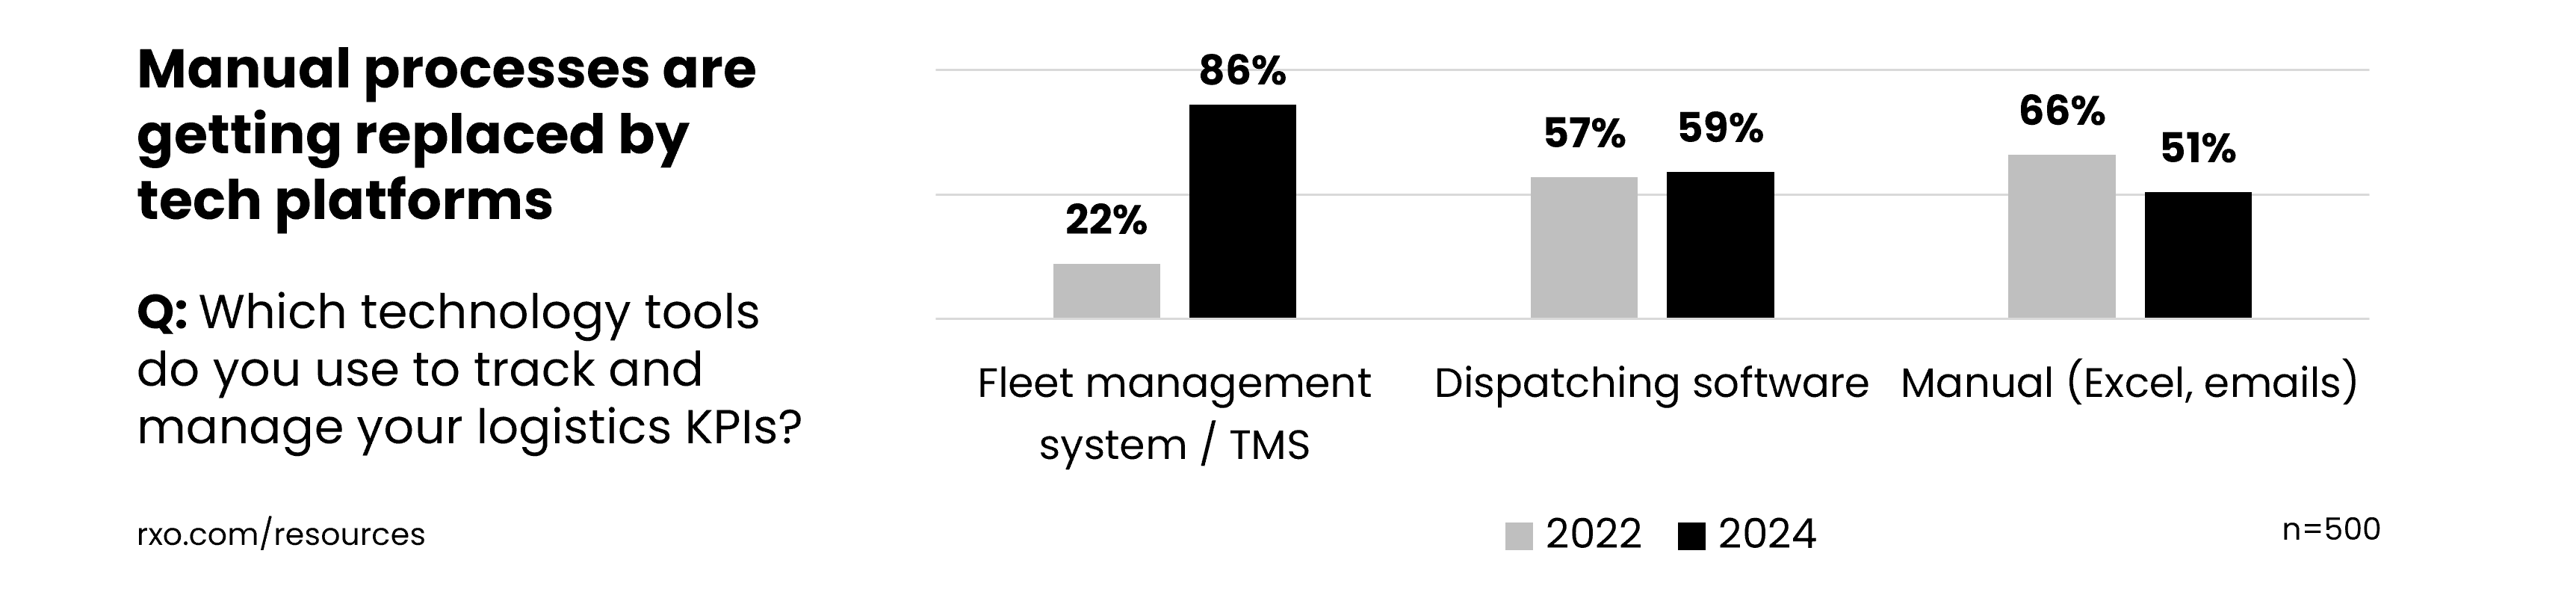
In 2022, 66% of carriers were relying on manual methods (Excel, emails, etc.) to manage at least some of their KPIs, making it the most frequently used method.
Over the past two years, manual methods have dropped down to 51% of respondents, and are now a distant second to fleet management system / TMS (86% of respondents, up from 22%) and dispatching software (59%, up from 57%).
How freight carriers are using AI
With their massive increase in fleet management software usage, it’s no surprise that 73% of carriers are also using AI in their operations.
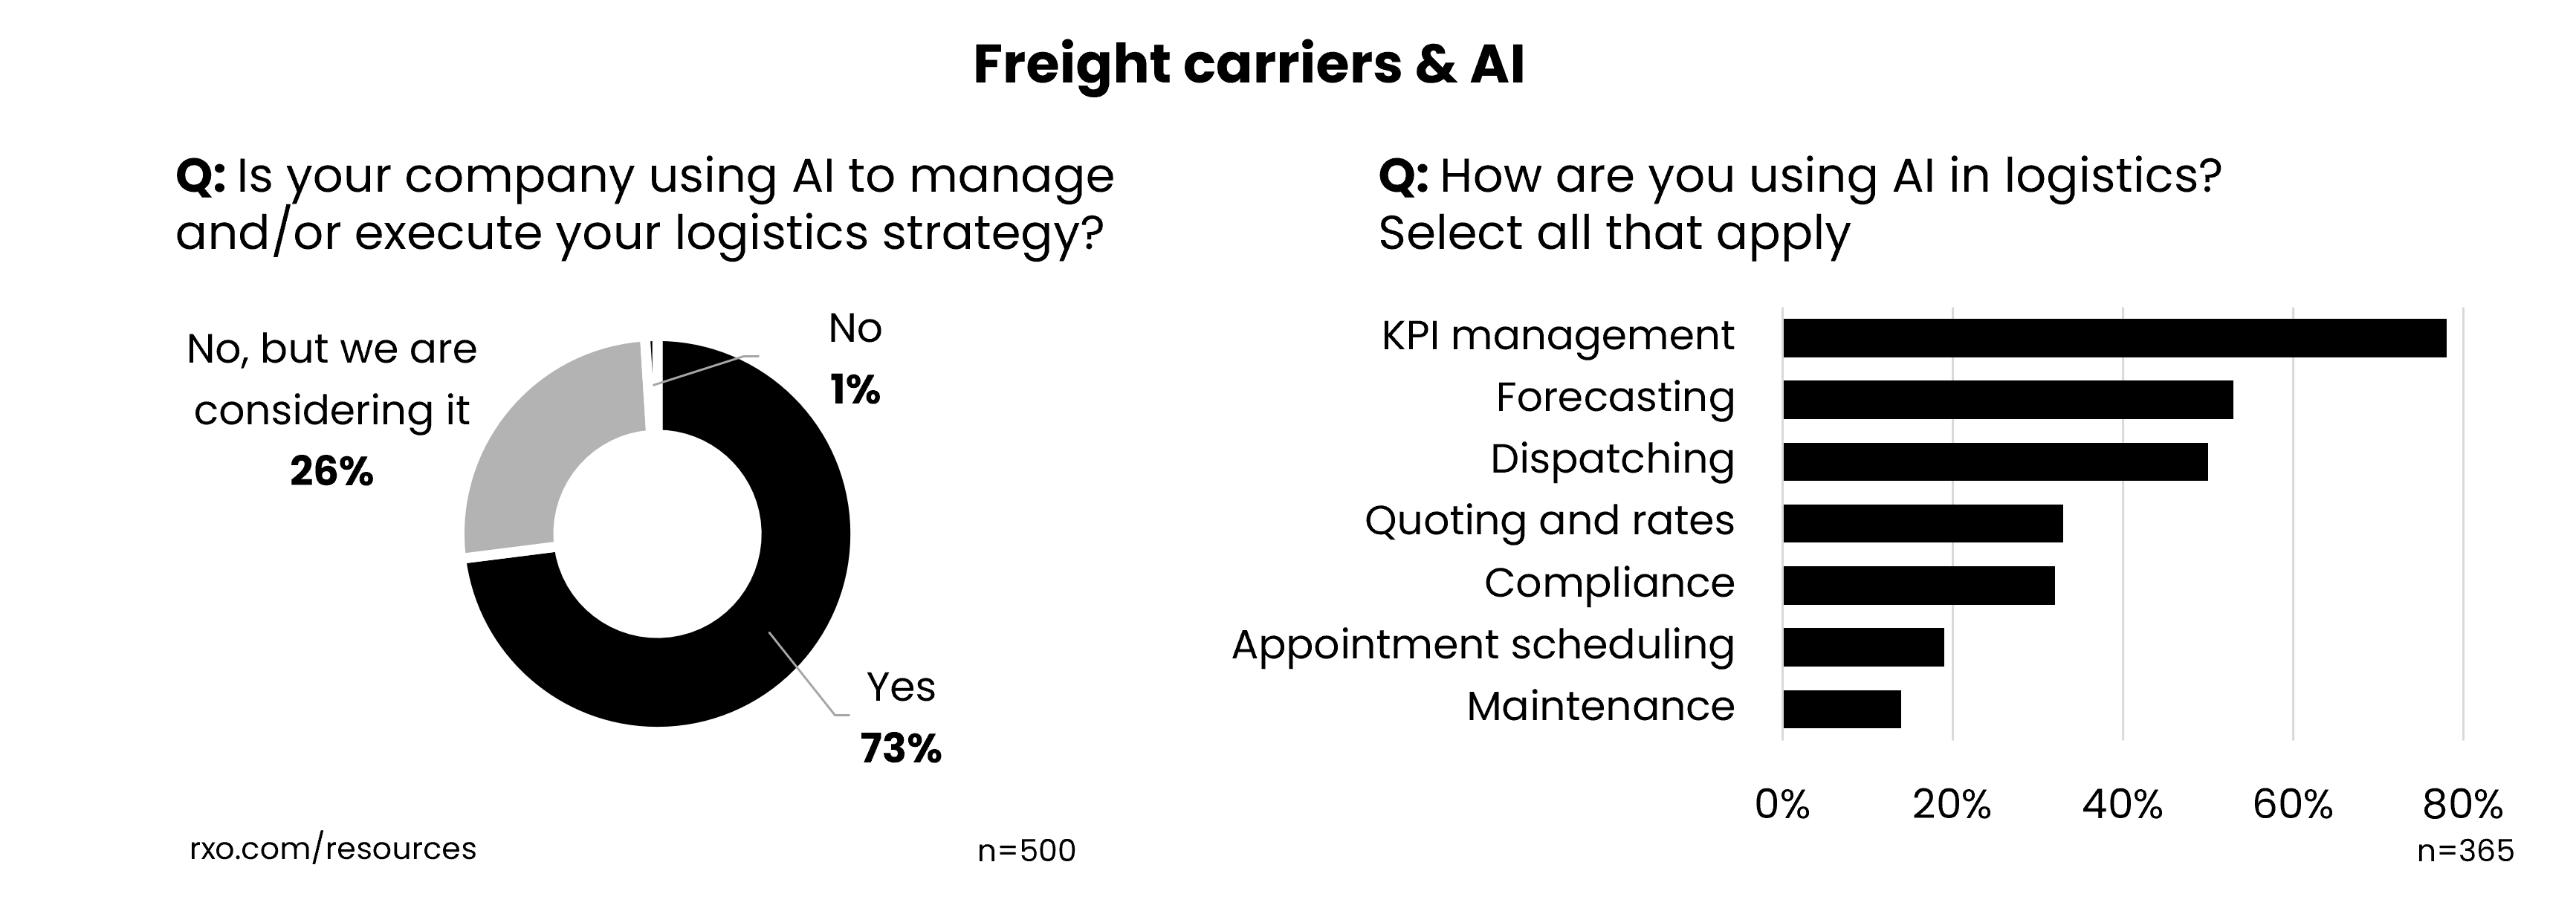
In terms of how they’re applying it, KPI management took the top spot, at 78% of AI users, followed by forecasting (53%) and dispatching (50%).

Carriers are getting integrated.
With more platforms comes the ability to better connect with providers. When asked how often carriers are setting up API integrations with core customers and 3PLs, 75% are either frequently or always getting connected.
But it’s not perfect.
Though technology is making it easier to get actionable insights from their network data, 80% of carriers still agree that turning KPI data into actionable insights is challenging and time consuming.
Insights for Working With Your Freight Providers
If you want to secure stable capacity and rates, you want to position yourself as a shipper of choice. Using the benchmarks is a good start, but there are a few other aspects to consider.
We covered how carriers are managing their KPIs, let’s get their perspective on how they think about shipper relationships.

KPI Standards and Securing Capacity
Setting high standards for your freight providers is important, but you need to balance a high-functioning supply chain with what’s realistic in the market.
When asked if they take shippers’ KPI expectations into account before agreeing to move a load, 73% of carriers answered yes.
In a tighter market where carriers have choices, overbearing KPI standards could result in a tougher time securing coverage.

Shipper-of-Choice and Freight Rates
Being an efficient, carrier-friendly shipper can be difficult, and can also require additional investments in labor resources, processes, technology, and/or facility upgrades. However, what may seem cumbersome today can pay off in the long run.
When asked how inefficient shipping practices (e.g., long loading times, inconsistent volume, poor appointment times) impact the truckload rates they give to their customers, 95% of carriers stated they have at least some impact, and 37% saying it has a significant impact.
While short-term cost-cutting measures may seem attractive, if they result in a noticeably worse carrier experience, almost all will just price that into their bids.

Carrier Scorecards Matter
It’s hard for carriers to improve performance if they don’t know where they stand. To have strong, long-term relationships with freight providers, clear, open communication is essential.
The best and most common way to share your KPIs and objectives with providers is the carrier scorecard. And carriers want to get them — 84% of carriers agree that scorecards are useful tools for performance improvement, up from 77% in 2022.
Shippers that aren’t using them in regular communications with core freight providers probably should be.

How often should you update your freight carriers?
Fluctuations in shippers’ load volumes can have a huge impact on carriers’ networks.
While forecasts are never perfect, and plans will inevitably change, the faster you can communicate with your freight providers the better they can pivot.
When asked how often their customers communicate updated demand forecasts (i.e., load volumes), 72% of carriers stated that they get weekly updates, with a third getting daily updates.
Shippers that aren’t keeping their providers updated on their network on at least a weekly basis should implement a better cadence

Who Offers Better Service: Asset-Based Carriers or Brokers/3PLs?
To build a resilient carrier network, diversity is important. When choosing between asset-based carriers and 3PLs/brokers, most shippers don’t approach it as binary decision, and instead use a blend of both.
Historically, there has been a general perception that 3PLs, while useful, aren’t as reliable as trucking companies with their own assets.
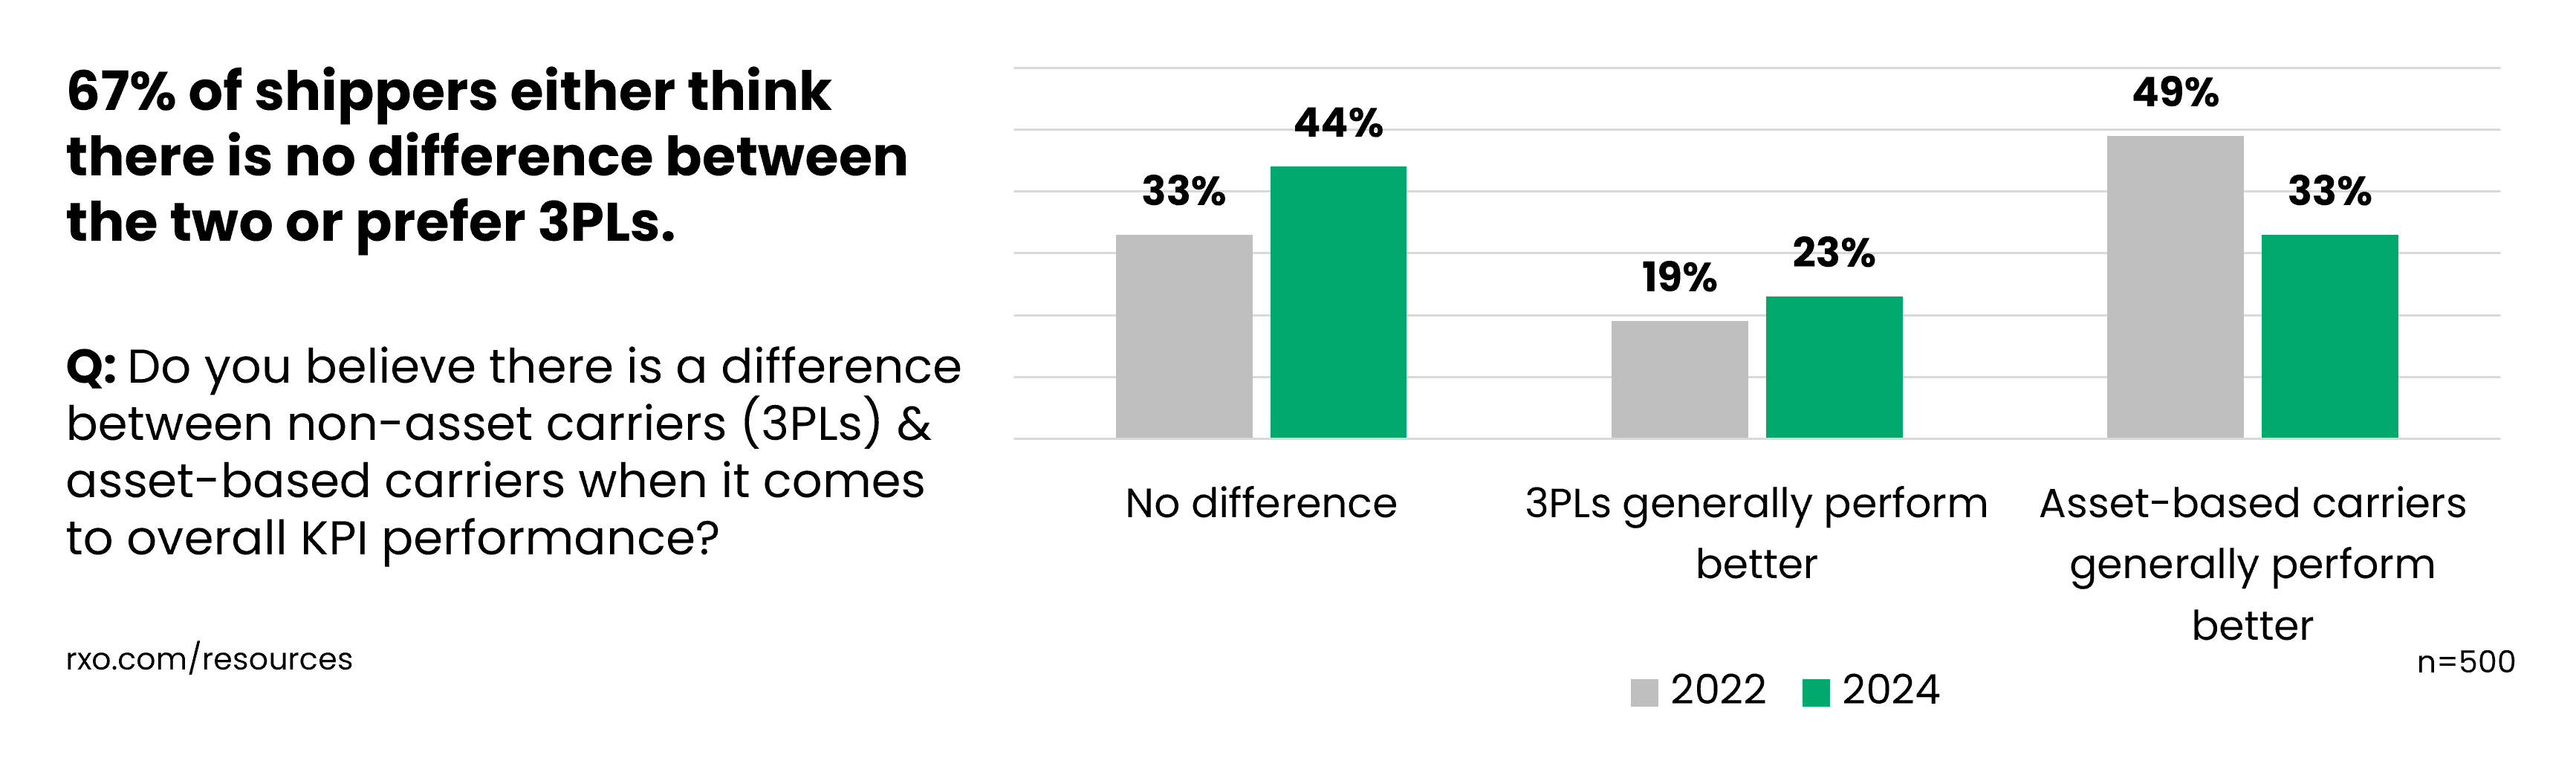
As 3PLs continue to take on a greater role in supply chains, we can see that this perception is shifting, and most shippers (67%, to be exact) either think that there is no difference or 3PLs actually perform better.
Shippers were most likely to think that there is no difference (44% of respondents, up from 33% in 2022), followed by asset-based providers having superior KPI performance (33%, down from 49% in 2022), and 3PLs having superior KPI performance (23%, up from 19% in 2022).
You can also download these charts as slides and/or the whole study as a PDF.
The best way to choose? Instead of looking at what type of provider, most shippers are looking at providers individually.
When asked if they’re using past carrier performance in the consideration process for an RFP, 57% of shippers do it all the time (up from 51% in 2022) and 98% do it at least some of the time (up from 95% in 2022).
Working With Freight Carriers: 5 Best Practices
- If your KPI standards are too high, 73% of carriers will think twice before taking your shipment
- Being a shipper of choice pays: bad shipping practices will get you higher rates from 95% of carriers.
- Carrier scorecards matter: 84% of carriers agree they help improve performance
- Keep carriers in the loop on your load plans: 72% of carriers are getting weekly updates.
- 3PLs are trustworthy: 67% of shippers either think there is no performance difference between them and asset carriers or think 3PLs are better.
Bringing It All Together:
Recapping the Top Trends in Logistics KPIs
Every logistics professional needs to understand their transportation KPIs, track them to the best of their ability, and leverage them to drive change in their operations.
This study gives you a better understanding of how your peers on both the supply and demand side of the market are using their performance metrics.
As you look to prepare your business for an increasingly volatile shipping environment, you can use these insights and benchmarks to help guide your strategy.
We’ve covered a lot of ground, so let’s conclude with a quick recap of a few of the study’s takeaways. Here are the top ten logistics KPI trends to help you run a more data-driven supply chain.
10 Logistics KPI Trends for 2025
- Love them or hate them, KPIs are essential.
89% of shippers and 90% of carriers agree that KPIs are an essential part of sound supply chain management, up from 83% and 85% in 2022, respectively.
- Shippers are more data-driven than ever.
86% of shippers reference their logistics KPIs at least weekly (up from 79% in 2022), with 45% of shippers referencing them daily (up from 32%).
- Carriers are more data-driven than ever, too.
80% of carriers reference their KPIs at least weekly (up from 59% in 2022), with 46% of carriers referencing them daily (up from 16%). Furthermore, 84% of carriers agree that scorecards are a useful tool to improve performance, up from 68% in 2022.
- Though both sides are more KPI-savvy, it still isn’t easy.
76% of shippers and 80% of carriers agree that turning KPI data into actionable insights is challenging and time consuming.
- Everyone wants a standard (even more than before).
87% of shippers and 90% of carriers agree that there should be a set KPI industry standard that everyone can agree on, up from 78% and 74% in 2022, respectively. Furthermore, there is a strong consensus for shared responsibility — 89% of shippers and 90% of carriers think both shippers and carriers should be held accountable for hitting those KPI standards.
- Though slightly more lenient, logistics performance benchmarks haven’t changed much since 2022.
Industry performance standards for core transportation KPIs (on-time performance, payables, tender acceptance, etc.) are generally consistent with 2022, though underlying data trended to be a bit laxer.
- Being a shipper-of-choice can actually get you better rates and more capacity.
95% of carriers said inefficient shipping practices impact the rates they give to shippers, and 99% of carriers take a shipper’s KPI expectations into account before agreeing to move a shipment.
- Performance is still king, but shippers are more cost-conscious.
When asked whether they prioritize cost or service in their supply chain strategy, most shippers (65%) said they focus on service; however, this was down from 77% in 2022.
- Shippers think 3PLs are more reliable than ever.
When asked to compare 3PLs and asset-based carriers in terms of KPI performance, 44% of shippers said there is no difference (up from 33% in 2022), 33% said asset-based carriers perform better (down from 49%), and 23% said 3PLs perform better (up from 19%).
- Despite a volatile, fragmented market, shippers and carriers are pretty aligned.
Looking across virtually every data point from this in-depth study, generally speaking, shippers and carriers were much more likely to agree than disagree.
Want to see your industry’s benchmarks?
We gathered a ton of interesting data in our logistics KPI research — too much to unpack in one study.
To make the insights digestible, we created a few deeper dive pieces of content for you.
You can get an overall breakdown of the results by industry, or check out individual industry profiles:
Need help running a more data-driven network? RXO can help
76% of shippers think turning KPI data into actionable insights is challenging and time consuming — but it doesn’t have to be.
Partnering with the right logistics provider can make running a data-driven supply chain easier. Whether you’re looking for help with sourcing reliable capacity, levelling up your logistics technology, getting more strategic with your procurement, or outsourcing your transportation network, RXO has the scale and expertise to make it happen.
Visit rxo.com to learn more about smart solutions to move your freight.
Respondent Demographics & Study Methodology
To get actionable insights on how shippers and carriers are approaching their transportation metrics, we worked with Qualtrics to source an independent panel of 1,000 U.S. logistics professionals, including 500 shippers and 500 carriers, from businesses in a range of sizes.
All respondents were anonymous, and self-identified as having deep knowledge of, and regular interaction with their company’s logistics KPIs. Responses were completed in September of 2024.