
Whether you’re shipping fresh produce, cans of soda, bags of chips, or frozen meat, as a food and beverage shipper, you know how important it is to stay on top of your transportation data.
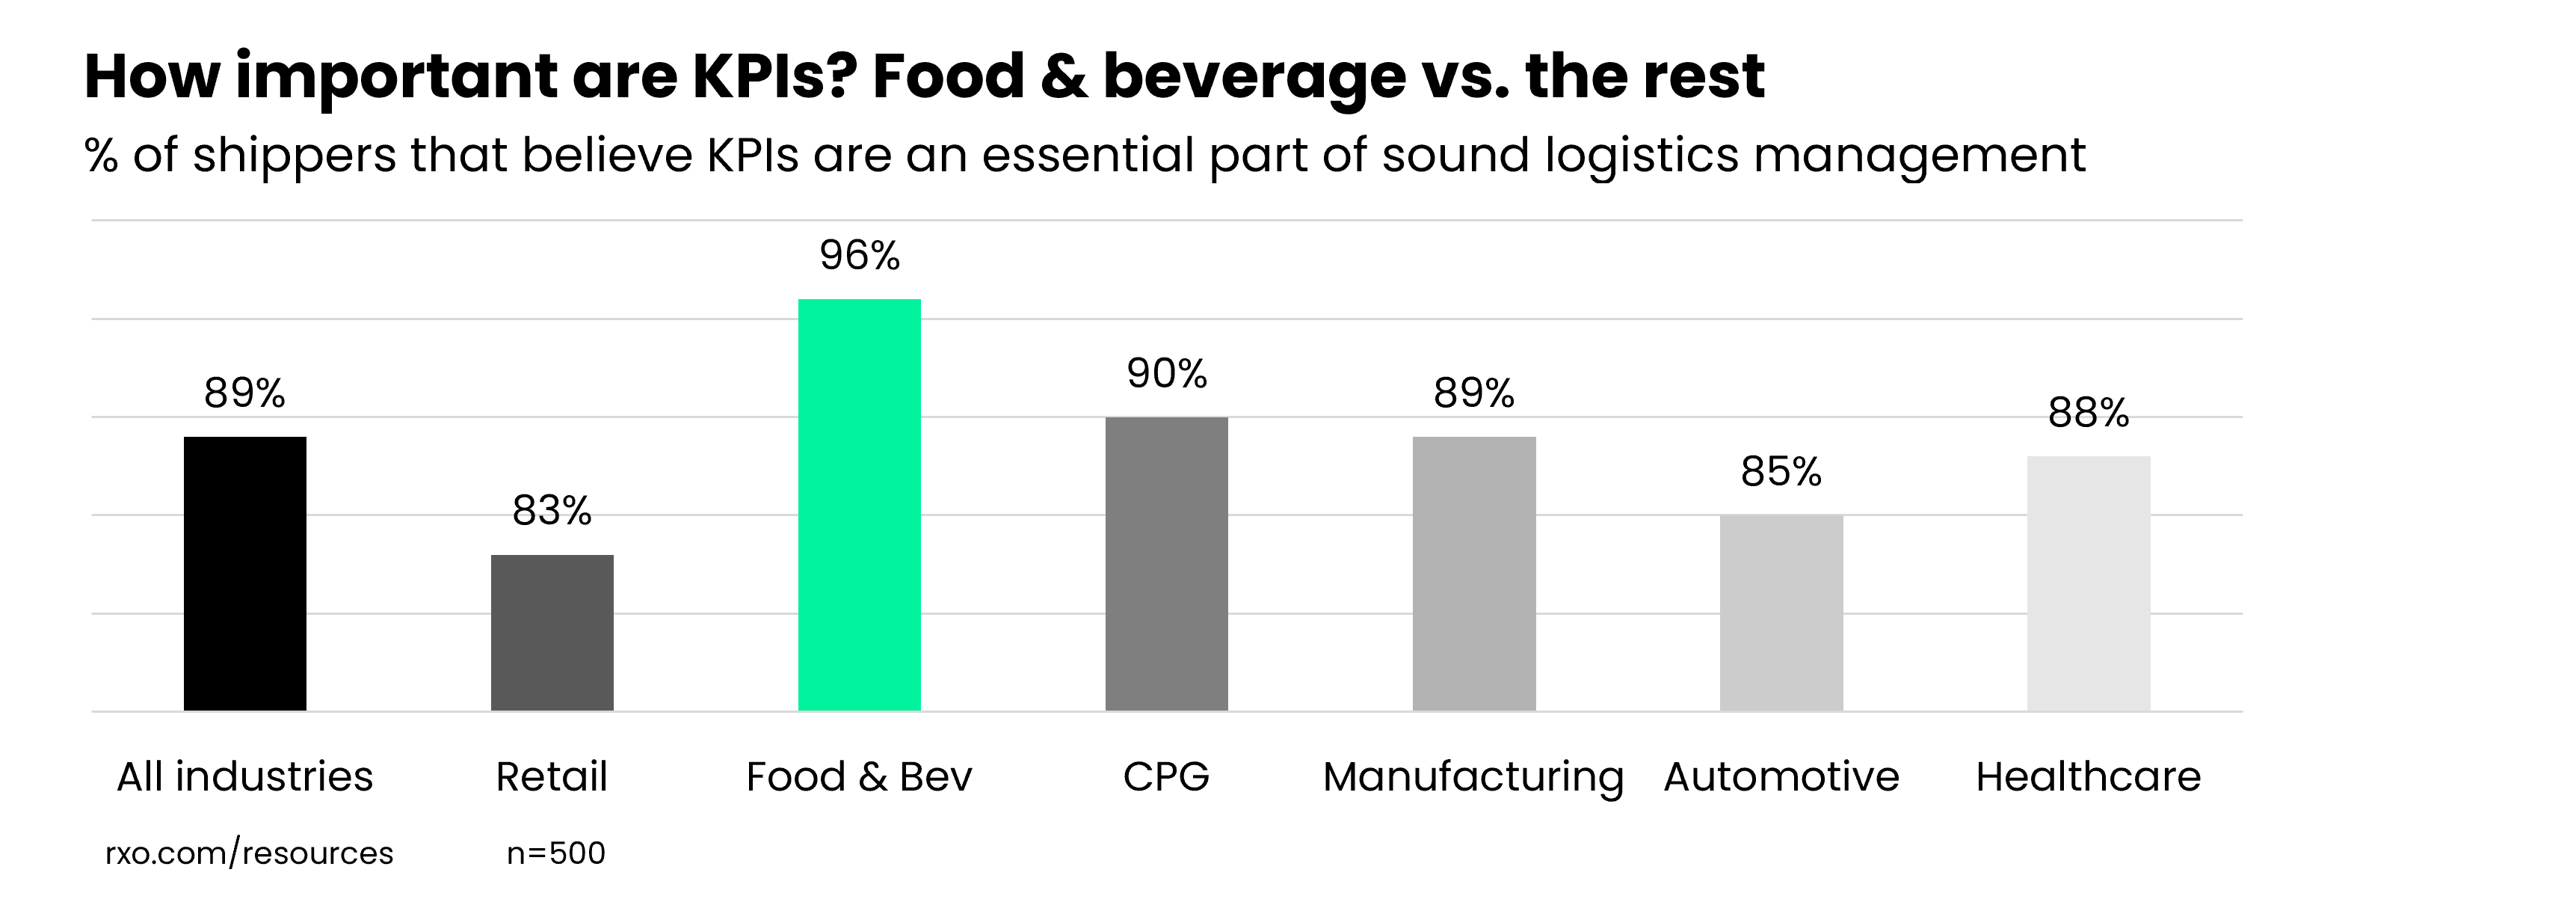
In fact, according to our latest original research study, 96% of food and beverage shippers agree that KPIs are an essential part of sound logistics management.
In the study, we worked with an independent market research firm to survey 1,000 shippers and carriers. Our goal was to create a resource that shippers of all kinds could use to better understand how their peers are setting and managing their logistics KPIs.
But what about the research insights for food and beverage shippers, specifically?
Below, you’ll find a breakdown of the results looking at the food and beverage shippers only (100, to be exact). Get their top logistics trends and the industry standards they use for setting KPIs.
6 Data-Backed Logistics Trends for Food & Beverage Shippers
1. Food and beverage shippers are all-in on logistics KPIs.
96% of food and beverage shippers thought KPIs were an essential part of logistics management — that figure was 7% above the average and the highest out of any industry.
Furthermore, 59% of food and beverage shippers are tracking their KPIs daily, which was 14% above the average and second overall (behind automotive at 66%).
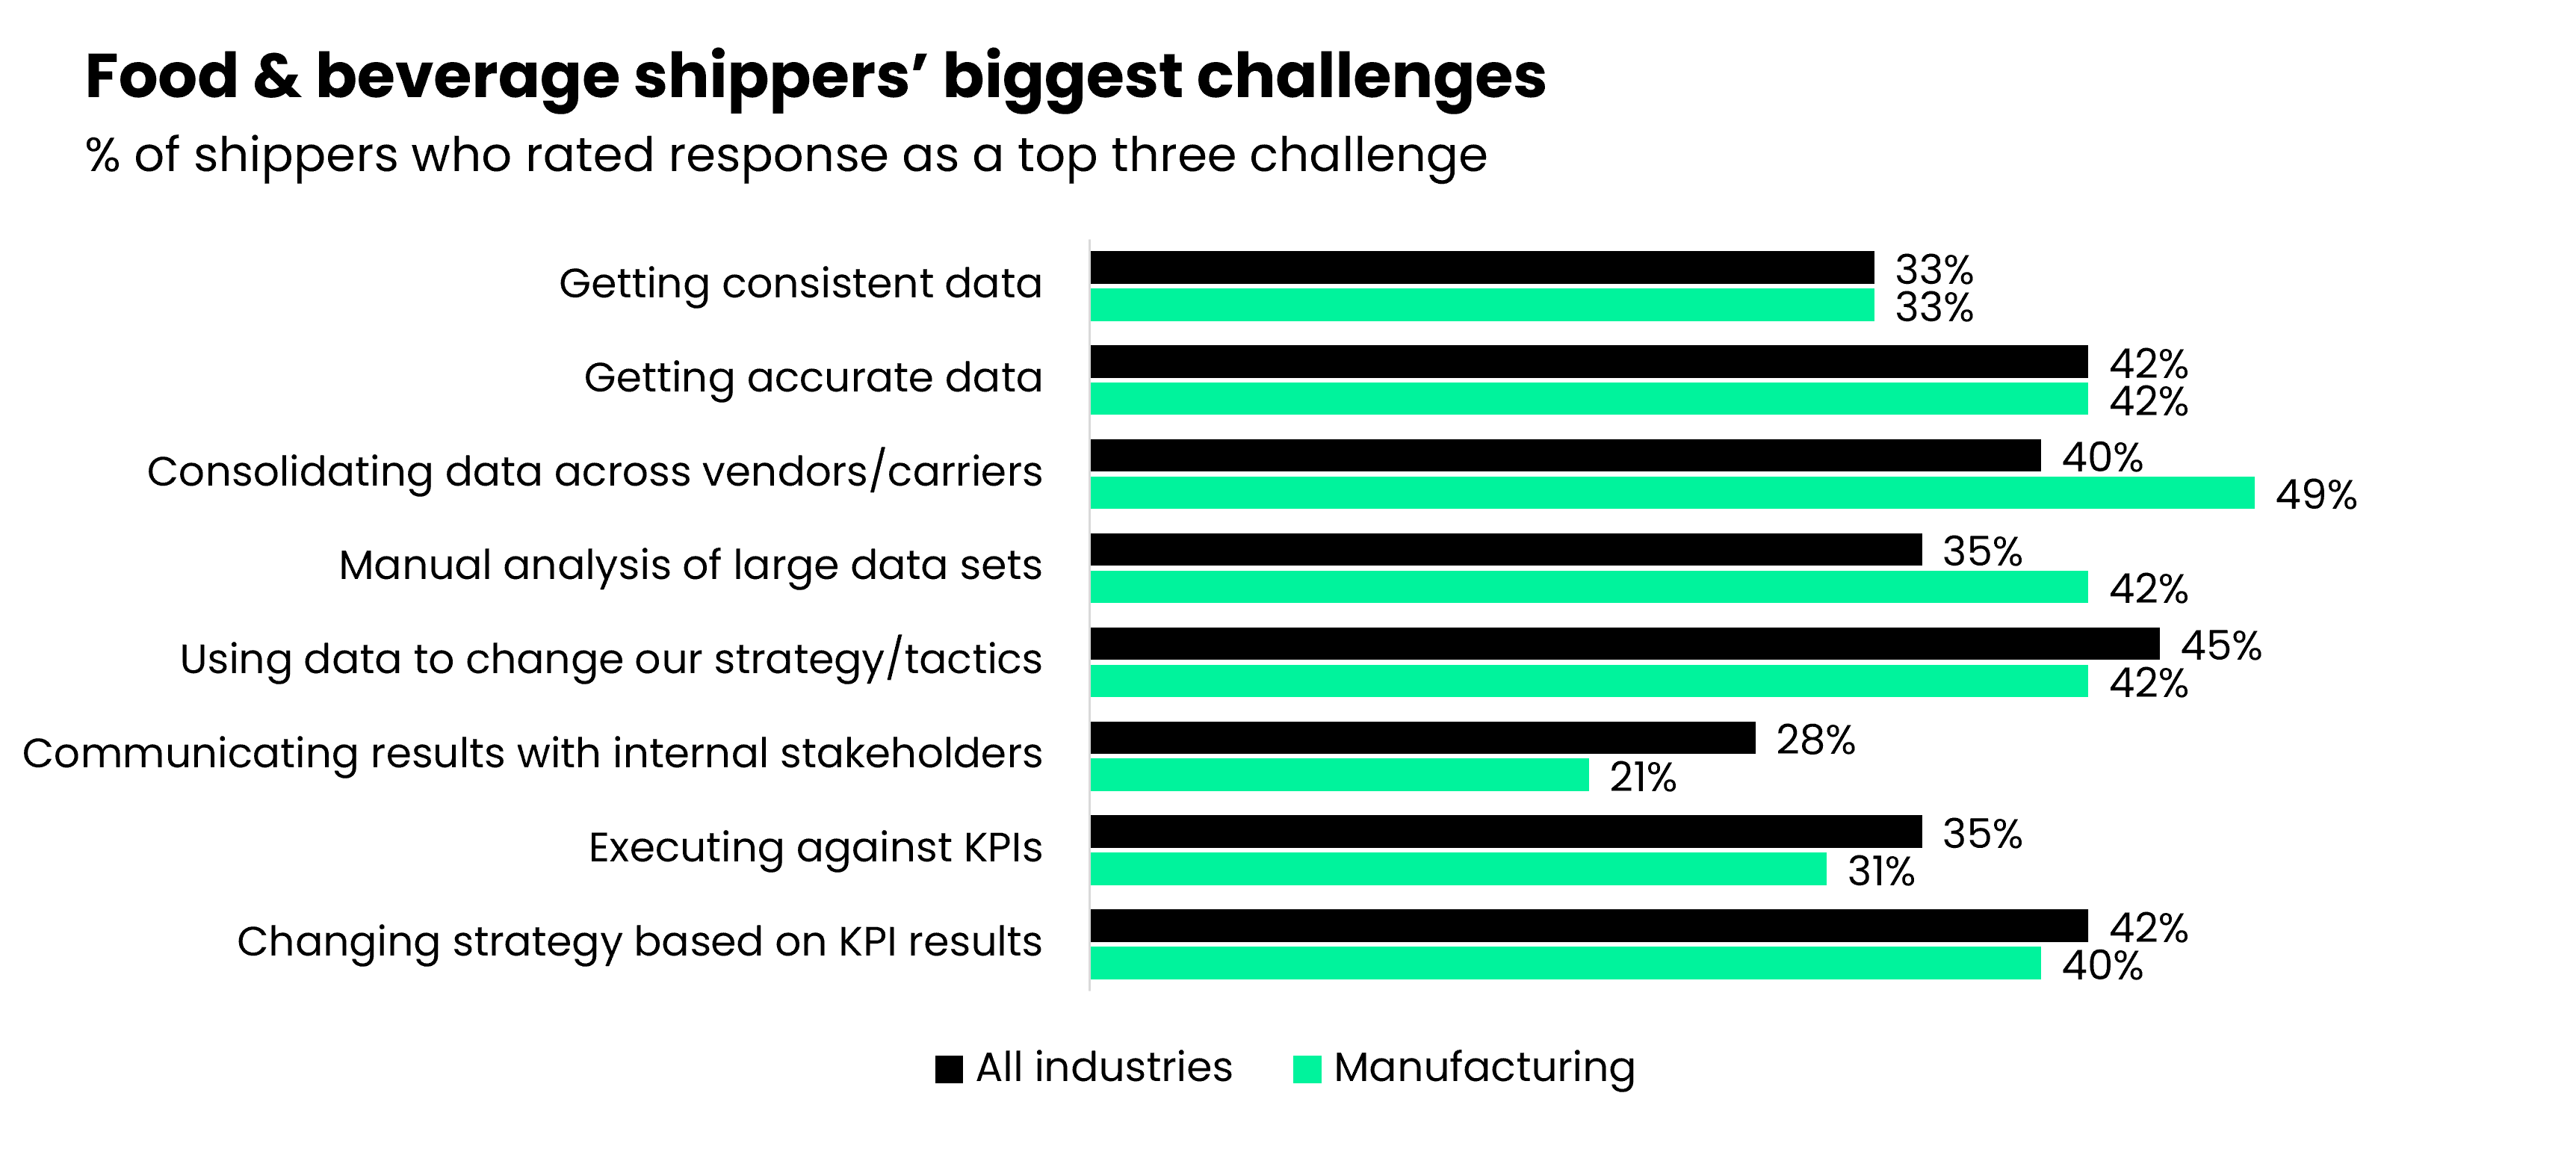
2. Putting KPI data to good use is a challenge.
When asked about their biggest challenges, changing strategy based on KPI results was food and beverage shippers’ top choice, with 47% of respondents believing it to be a top challenge.
Their second overall challenge was using data to change tactics, at 44% of respondents.
3. Food and beverage shippers are the hardest hit by OTIF.
95% of food and beverage shippers have to deal with on-time in-full (OTIF) requirements — more than any other industry and 10% above the average.
97% also said that OTIF has impacted their procurement strategy.
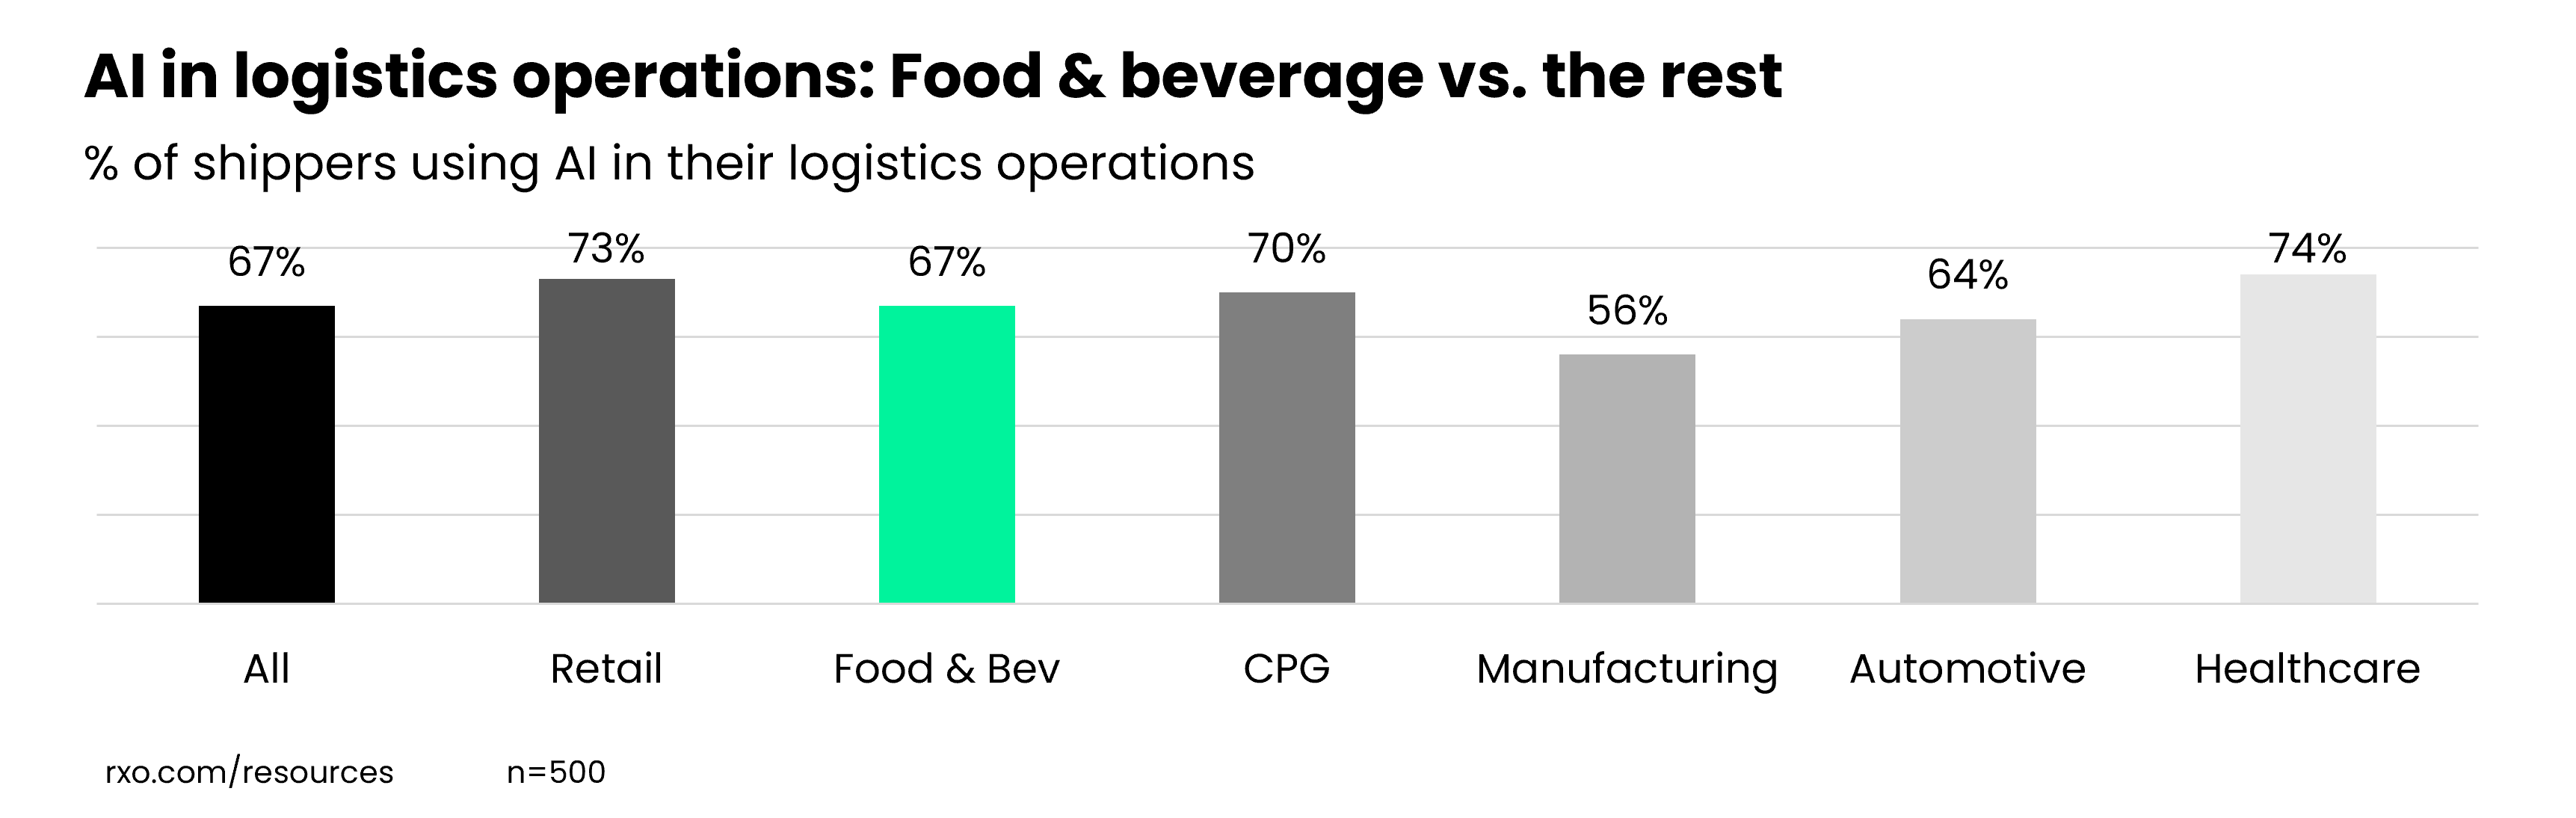
4. Most food and beverage shippers are experimenting with AI.
67% of food and beverage shippers are using AI in their logistics operations, which is equal with the average across all industries.
And they are optimistic about the possibilities — 92% believe that technology will make KPI tracking and management much easier in the next two years.
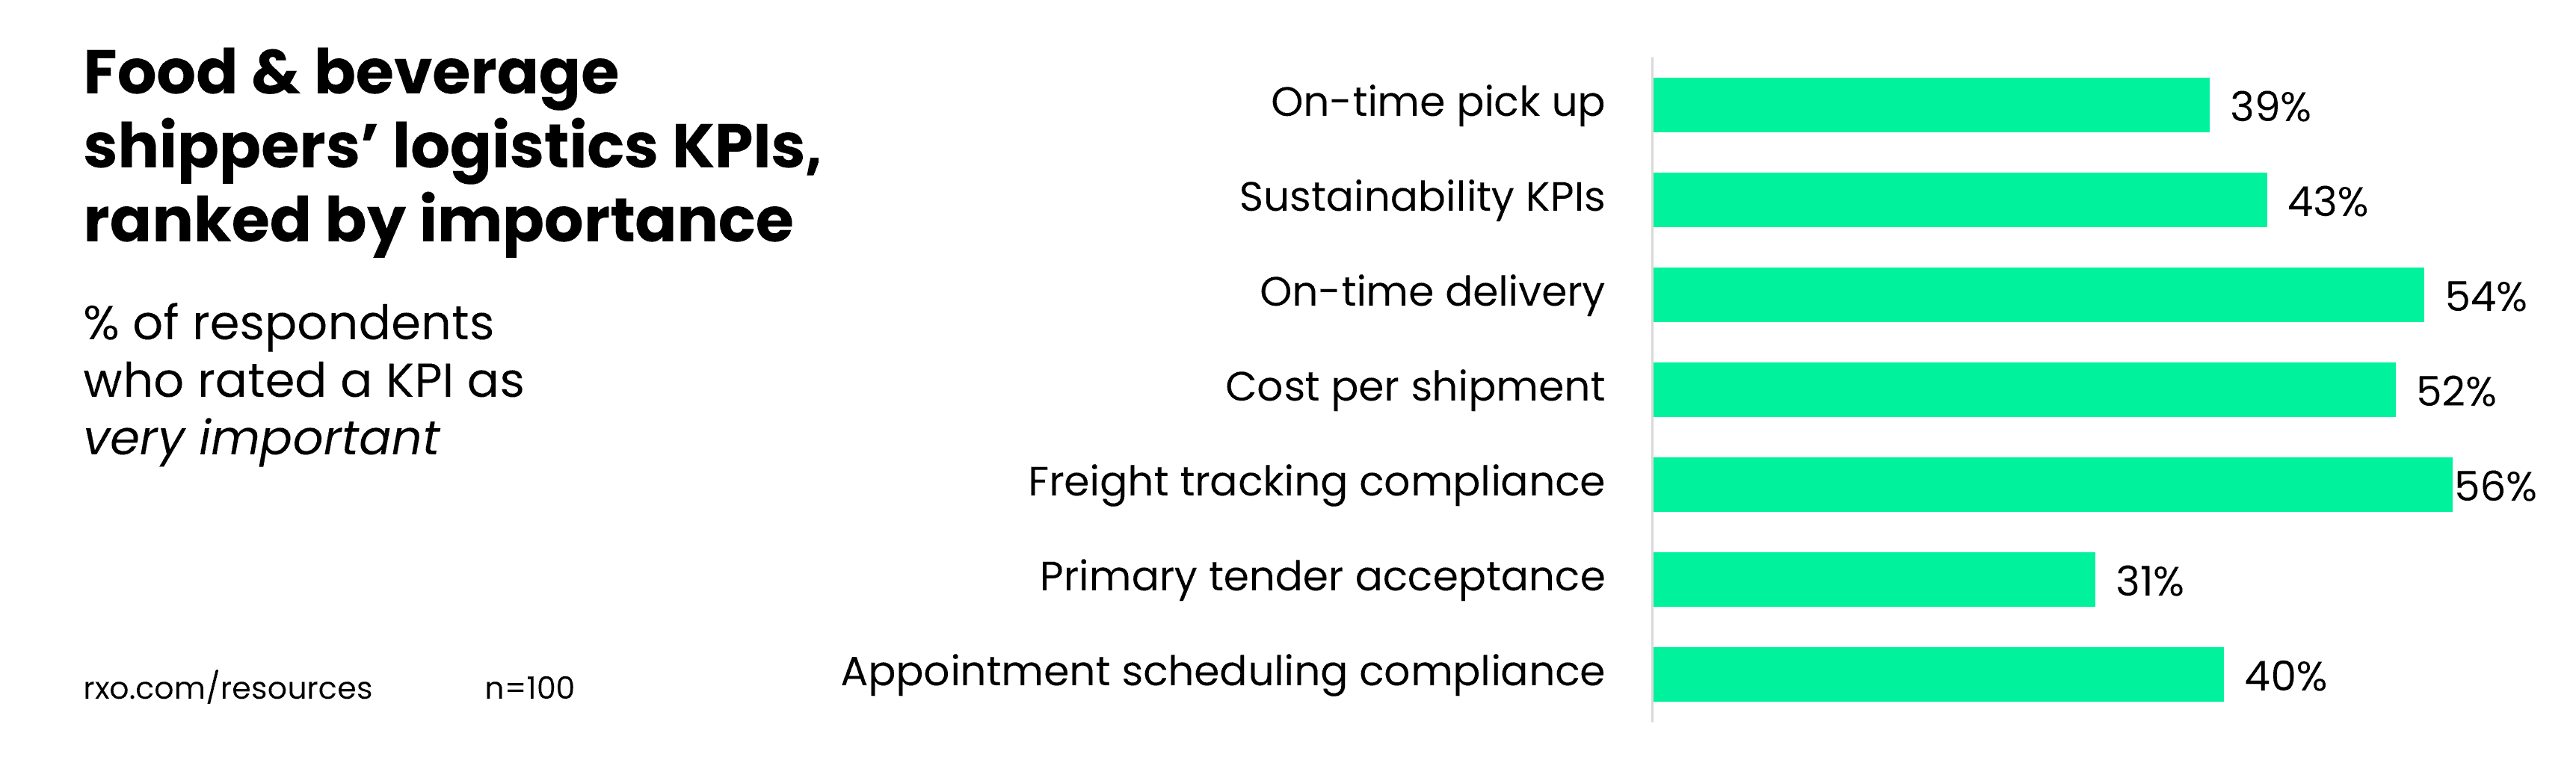
5. Carrier compliance matters the most.
All KPIs are important — the K stands for “key” after all — but when asked to rate every core transportation metric by level of importance, freight tracking compliance and appointment scheduling compliance stood above the rest, with 48% and 45% of food and beverage shippers saying they were very important, respectively.
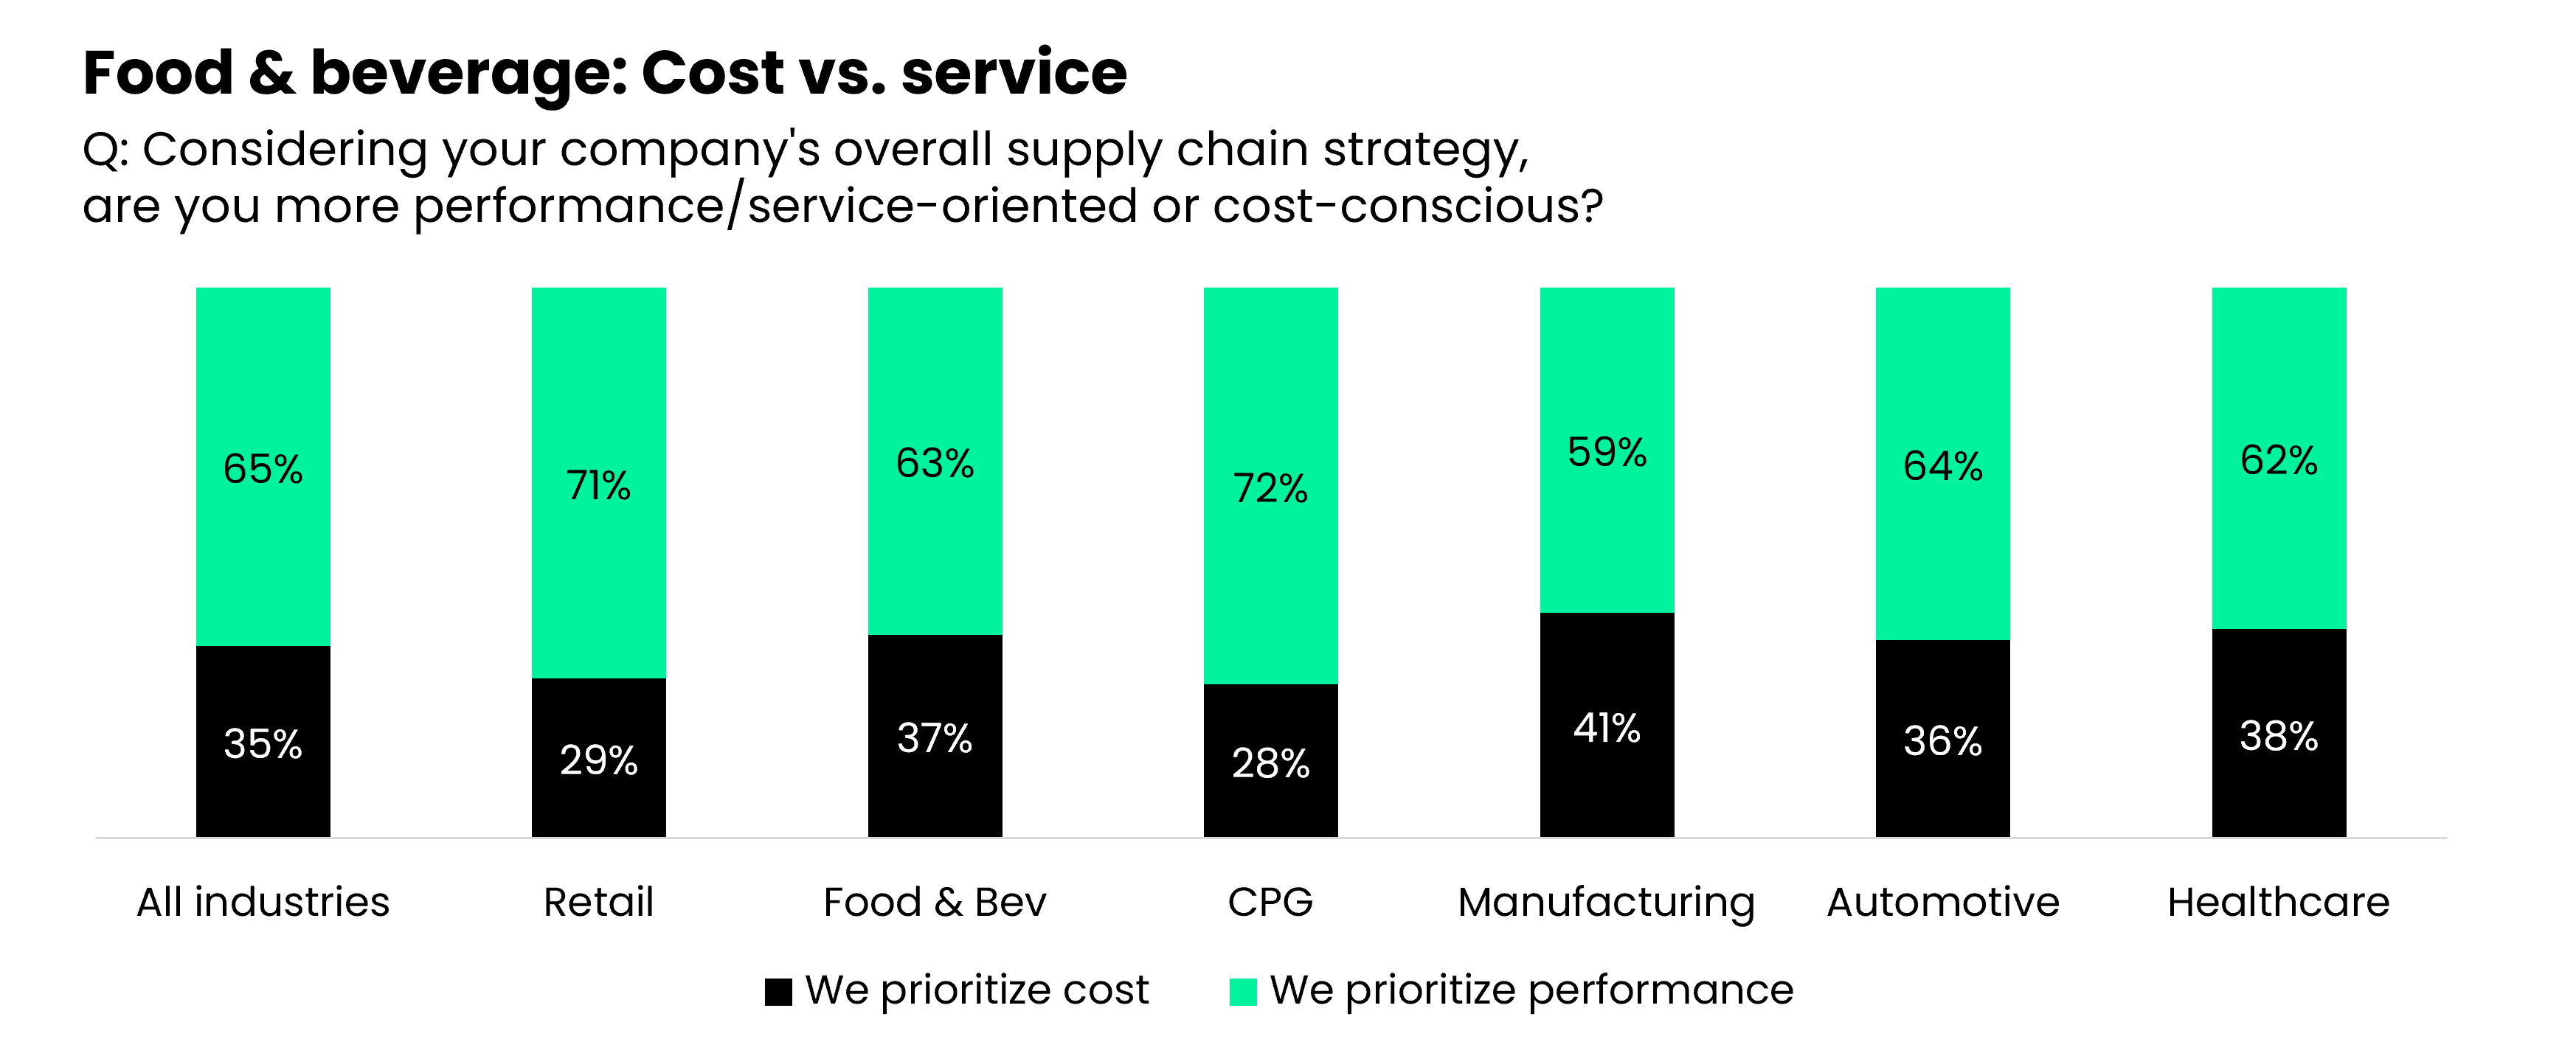
6. Food and beverage shippers are more service oriented.
Both cost and service are important in freight shipping, but we asked respondents which was most important to their organization.
For food and beverage shippers, it was service, with 63% of respondents saying they prioritize performance over cost. However, this was 2% lower than the average across all industries.
Logistics KPI Standards, According to Food & Beverage Shippers
We’ve covered the trends, now let’s look at what food and beverage shippers think are acceptable performance standards for the most common logistics KPIs.
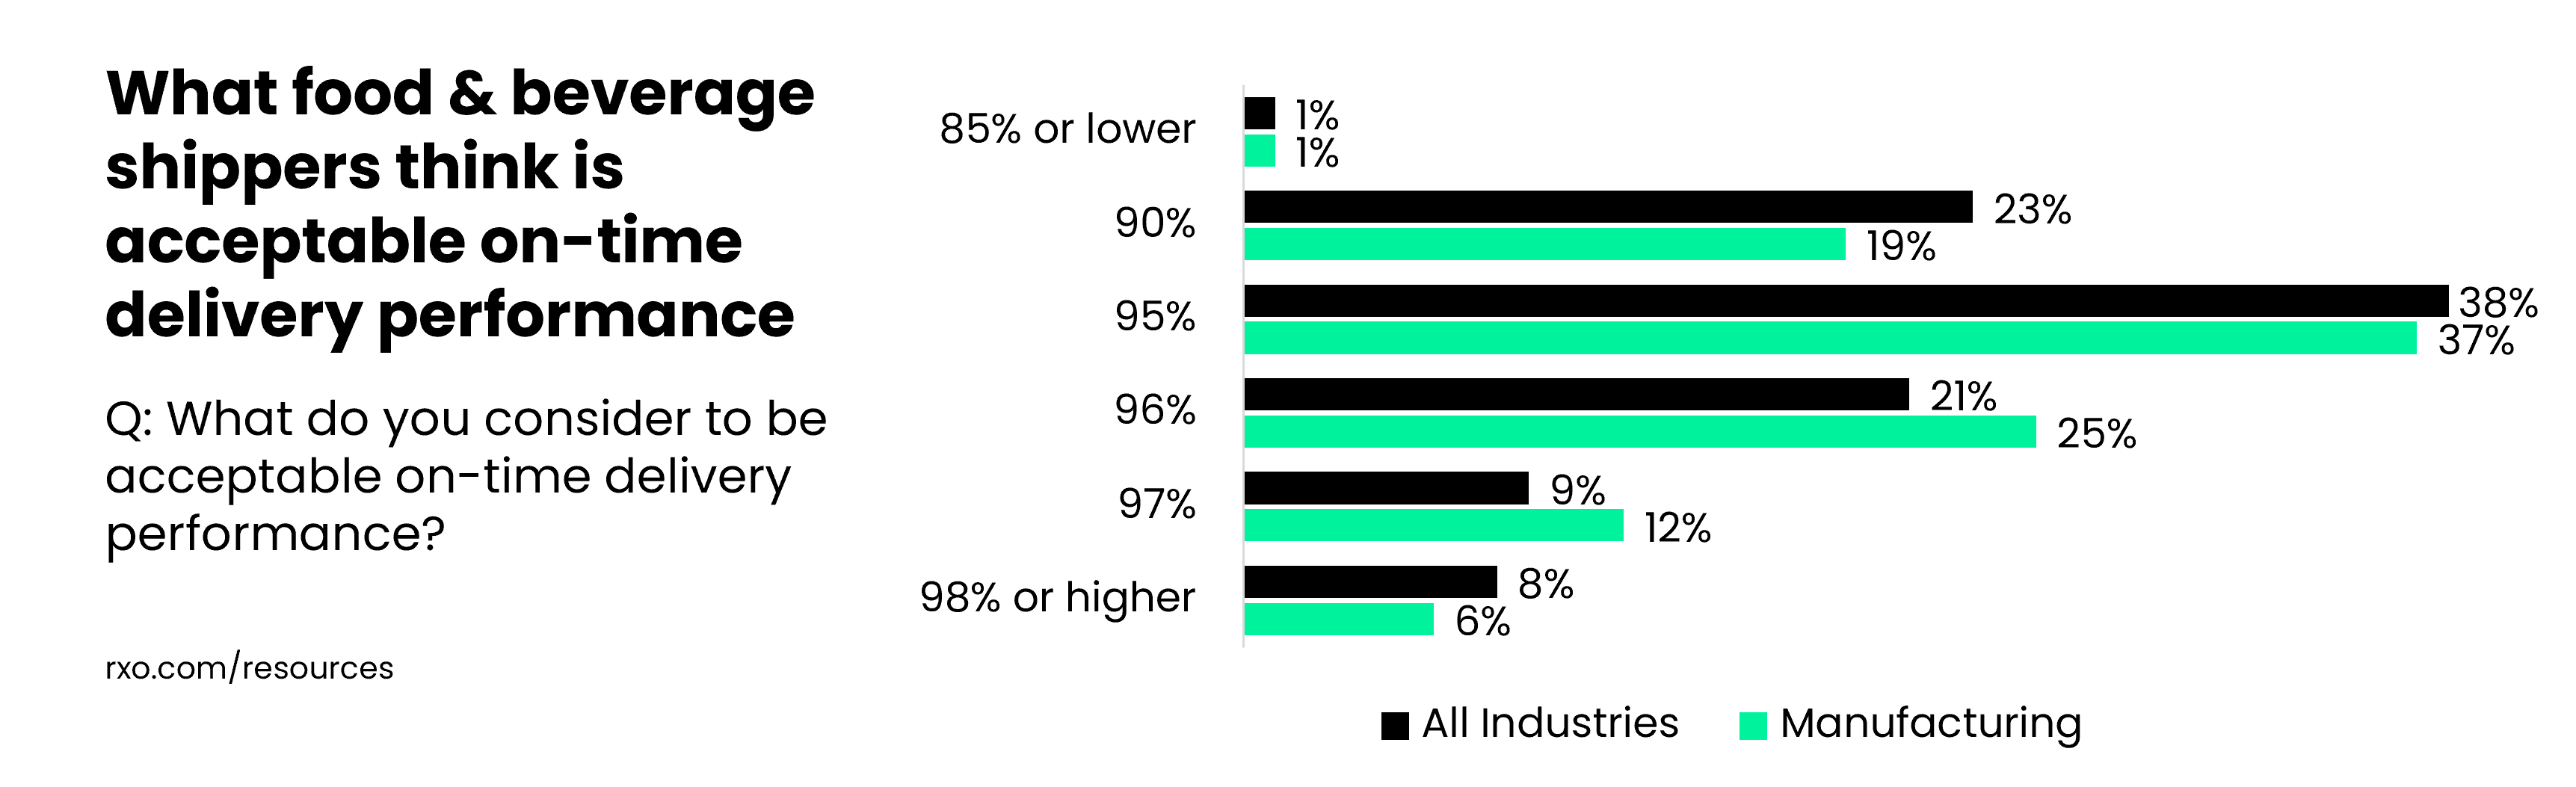
On-time delivery performance
We asked food and beverage shippers what they consider to be acceptable on-time delivery performance from their carriers. Here’s what they had to say, and how it compares to average across all industries in the study.
- Performance standard across all industries: 95% on-time delivery performance
- Food and beverage shippers’ standard: 95% on-time delivery performance
- Food and beverage vs. the rest: In-line
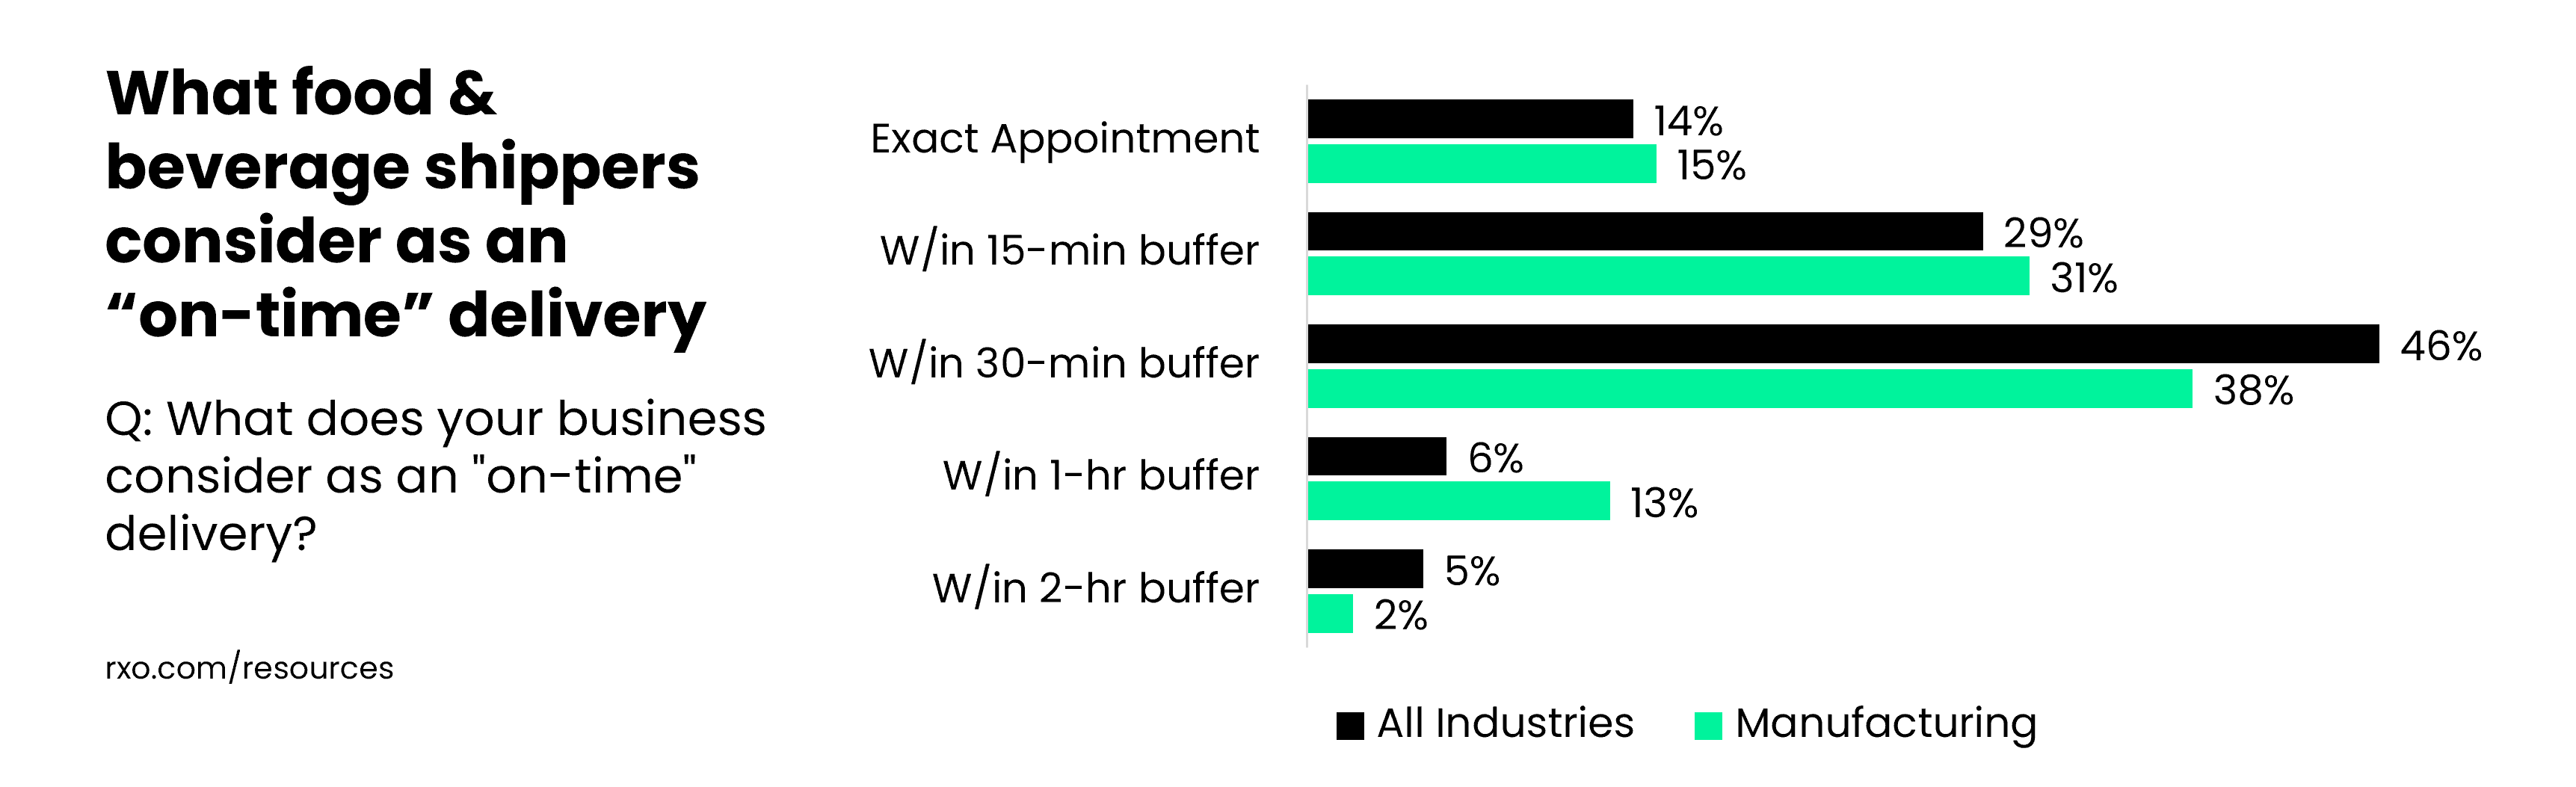
What is “on-time”?
We asked food and beverage shippers what they consider as an “on-time delivery” from their carriers. Here’s what they had to say, and how it compares to average across all industries in the study.
- Performance standard across all industries: On-time to an appointment with a 30-minute buffer
- Food and beverage shippers’ standard: On-time to an appointment with a 30-minute buffer
- Food and beverage vs. the rest: In-line
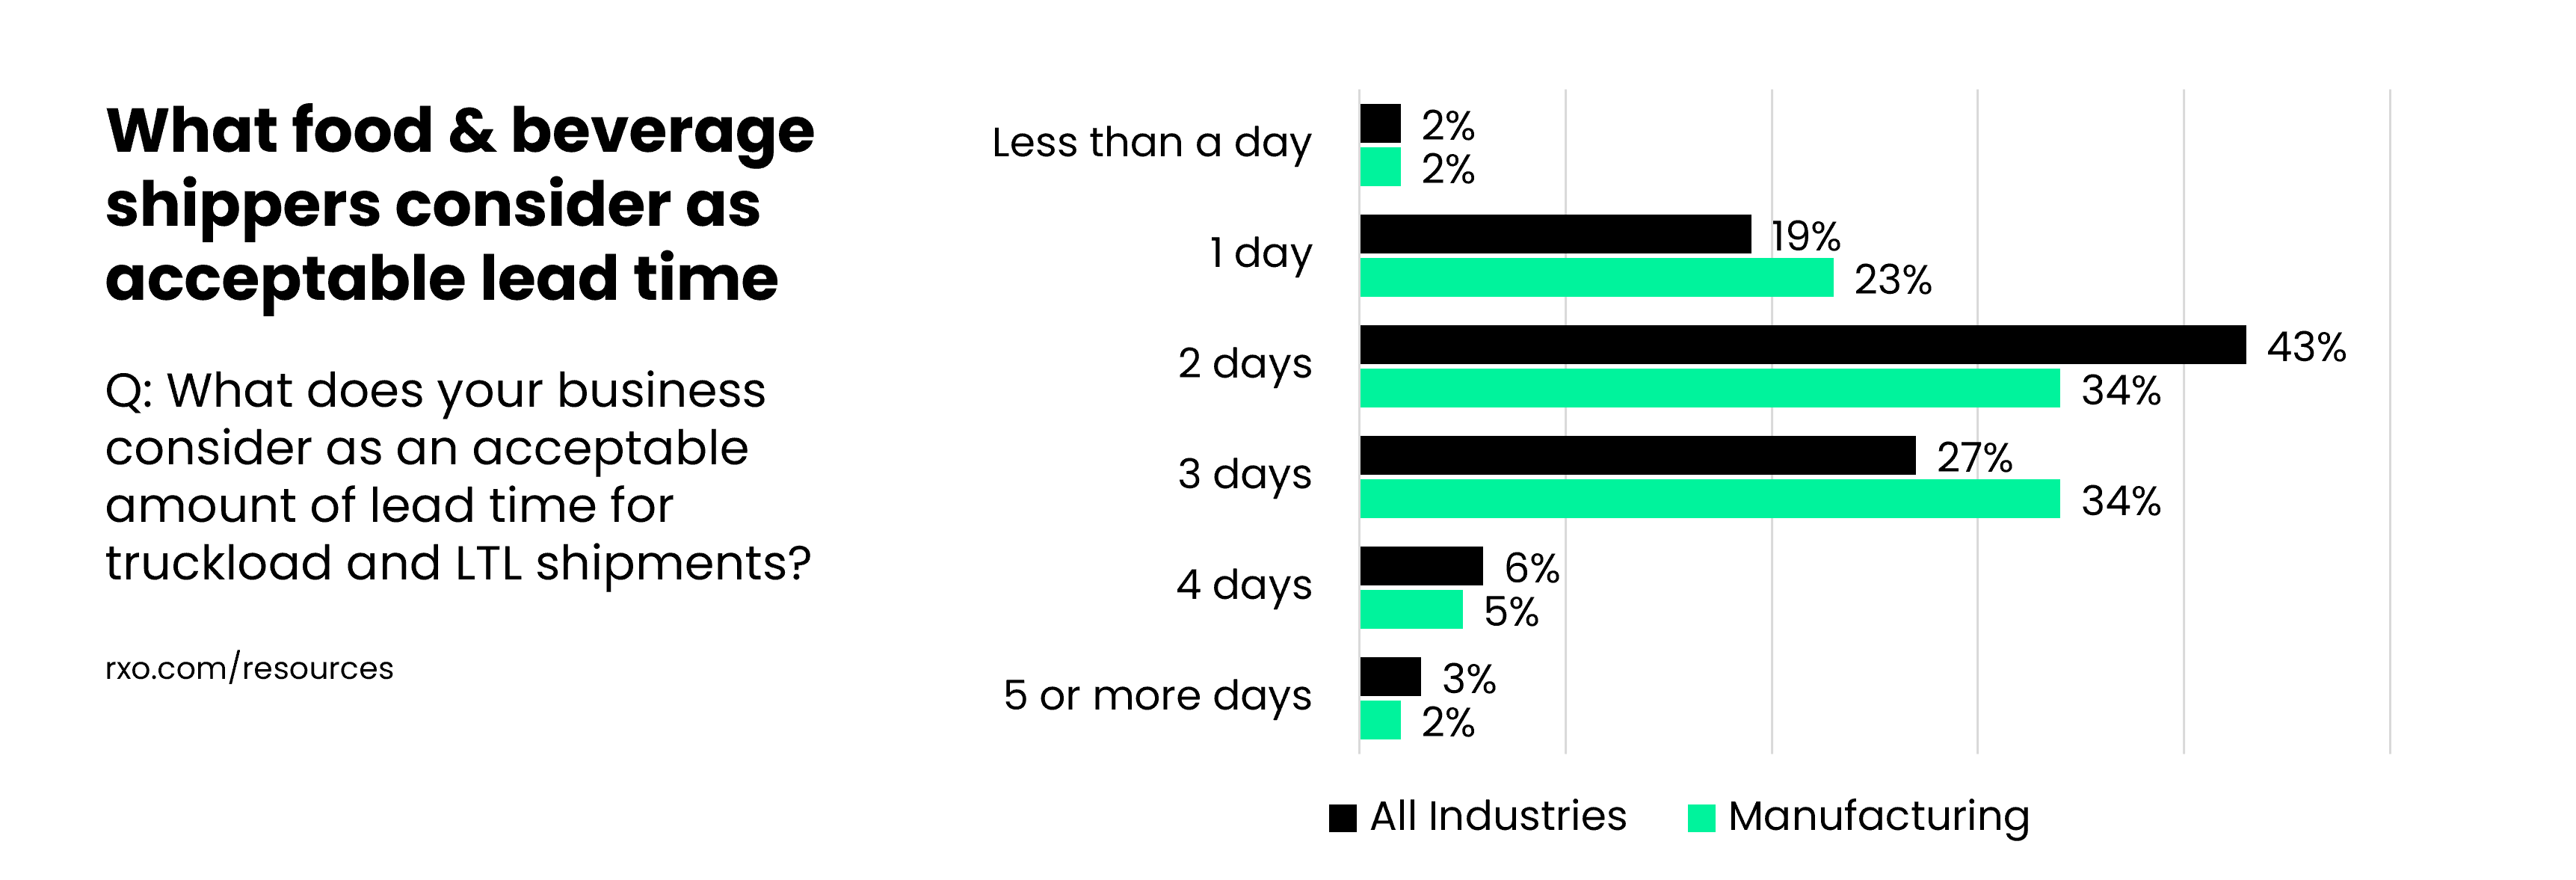
Shipment lead time
We asked food and beverage shippers how much lead time they think they should give to their carriers for truckload and LTL shipments. Here’s what they had to say, and how it compares to average across all industries in the study.
- Performance standard across all industries: 2 days of lead time
- Food and beverage shippers’ standard: 2 days of lead time
- Food and beverage vs. the rest: In-line
Primary tender acceptance
We asked food and beverage shippers what they consider to be a reasonable primary tender acceptance rate from their carriers. Here’s what they had to say, and how it compares to average across all industries in the study.
- Performance standard across all industries: 85% acceptance rate
- Food and beverage shippers’ standard: 90% acceptance rate
- Food and beverage vs. the rest: More demanding to freight providers
Demand forecasting accuracy
We asked food and beverage shippers what they consider to be an acceptable level of variance from their shipment forecast (in terms of load volume). Here’s what they had to say, and how it compares to average across all industries in the study.
- Performance standard across all industries: Within 10% of forecasted volume
- Food and beverage shippers’ standard: Within 10% of forecasted volume
- Food and beverage vs. the rest: In-line
Payment terms
We asked food and beverage shippers what they consider to be acceptable payment terms to their carriers. Here’s what they had to say, and how it compares to average across all industries in the study.
- Performance standard across all industries: Payment within one week
- Food and beverage shippers’ standard: Payment within 30 days
- Food and beverage vs. the rest: More demanding to freight providers
Keep Learning About Logistics KPIs
Want more interesting data from our logistics KPI research?
Read the full research study, an overall industry breakdown, or checkout out individual industry profiles: